Understanding Structured Products Series 8 - Beyond the Discount: The Accumulator Through Institutional Eyes

Prologue – When Loridy Joined the Table
Last time in Series 7, Tom and Jerry walked Ada and Jane through the basics of an Accumulator—using NVDA at $100 as the example:
• The strike that magically appears “at a discount”
• Buying shares daily
• Delivery doubling when NVDA drops below strike
• A knock-out that ends the game early
It was a friendly, intuitive explanation. But as soon as the article went out, Ada wrote again:
“I get it now. But how would a professional investor look at this? Do funds that run billions still like the Accumulator?”
Tom didn’t answer immediately. He smiled and forwarded the question to someone who would. A day later, a new face appeared at their table—a woman in a navy suit, with a calm, analytical tone.
“Hi, I’m Loridy. I run multi-asset and derivatives strategies at an institutional fund.”
Jane perked up. “Wow, so you manage real big-money portfolios?”
“Yes. I also read your Series 7,” she said with a grin.
“Great intro. But from a buy-side perspective, the Accumulator looks… not quite how retail investors imagine it.”
“How so?” Ada asked.
“Well— Retail investors see the ‘discounted entry.’ Professionals see the volatility exposure, the Gamma shape, the path-dependency, and the very deliberate way banks design the product.”
Jerry tapped his notebook.
“Perfect. Then let’s do Series 8 your way. What does the Accumulator really look like from the buy-side?”
And with that, the real deep dive began.
II. A Sharper, Institutional Recap of Series 7
“Let’s recap the NVDA example quickly,” Tom said.
Loridy nodded.
“Good idea. But this time, let’s describe the structure using the language we use on institutional desks.”
2.1 The True Structure: 2 × Put – 1 × Call (with KO)
Using NVDA @ $100, the typical structure looks like:
• Sell 2 × OTM Put at strike $95
• Buy 1 × ITM Up-and-Out Call at $95, KO at $125
Banks solve for the strike K using:
2 × Put(K) = 1 × Call(K)
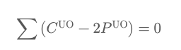
So the “discount at $95” is not a giveaway.
It is the market price of the risk you’re selling.

2.2 Daily Observation & Double Delivery
Series 7 showed this clearly:
• If NVDA closes below $95, you buy shares
• If it ever closes below $95 once,
your daily quantity doubles from 1,000 → 2,000
Loridy added:
“The risk isn’t just price risk. It’s accumulation speed risk.
Your size grows faster than NVDA falls.”
2.3 The Up-and-Out Knock-Out at $125
This feature exists for one reason:
• To reduce the value of the call, so the structure can be zero-cost.
If NVDA hits $125, the contract terminates immediately.
To investors:
• Upside is cut.
To banks:
• Hedge risk is controlled.
• Vega and Gamma exposure are limited.
Without KO → the call is too expensive → AQ cannot be zero-cost.
III. The Real Theme – How the Buy-Side Views the AQ
Loridy leaned forward.
“The Accumulator isn’t simply a cheap way to buy NVDA.
It is a leveraged way of selling volatility, selling Gamma, and selling the path of the stock.”
That perspective changes everything.
The institutional questions are:
1. How do banks use AQ to transfer risk?
2. How does the buy-side actually measure AQ’s risks?
3. Which parts do retail investors consistently underestimate?
Time to dive deeper.
IV. Loridy’s Professional Breakdown
4.1 Step 1 – What Are Greeks, Really?
Jerry asked:
“Before we go deeper—can you explain Greeks in a simple way again?”
Loridy nodded.
• Delta = how much your P&L moves when NVDA moves
• Gamma = how fast your Delta changes (Gamma = curvature, convexity)
• Vega = how sensitive you are to volatility changes
• Theta = what time decay does to you

“And in AQ?” Jane asked.
“The two short puts dominate everything. That’s where the Gamma and Vega risk sits. The long call? Its KO means its Greeks are weak.”
She continued:
• Gamma: very negative
• Vega: very negative
• Theta: unstable and direction-dependent
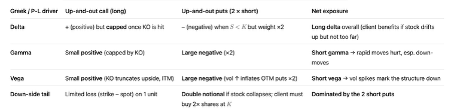
Then, in one line:
“Upside isn’t really yours. Downside is very much yours.”
Ada shivered.
“I suddenly feel less excited about the ‘discount.’”
4.2 Why AQ Is Path-Sensitive, Not Just Directional
“The most misunderstood part,” Loridy said, “is path dependency.”
NVDA ending at $95 in six months tells you nothing about how your AQ performed.
What matters is:
How did NVDA travel from 100 to 95?
Two paths:
Path A – Volatile but mean-reverting
100 → 110 → 92 → 105 → 95
• Some deliveries, manageable size
• Upside events reduce losses
• No catastrophic accumulation
Path B – Slow bleed
100 → 97 → 94 → 92 → 90 → 88
• Many days below 95
• Double delivery activated early
• Inventory balloons
• Average cost dragged upward
• Volatility rises → put value inflates
Both end at 95.
But Path B destroys the retail investor.
“Bad paths are more dangerous than bad prices.”

4.3 Why “Zero-Cost” Is an Illusion
Ada asked, “Is zero-cost really misleading?”
Loridy answered:
“You didn’t pay cash because you paid with something else— downside volatility.”
This is the institutional framing:
• You sold large amounts of downside vol
• The bank used that vol premium to fund the call
• KO suppresses the call’s cost → making the equation solvable
Her summary:
“Zero premium ≠ zero risk.
The real payment is exposure.”
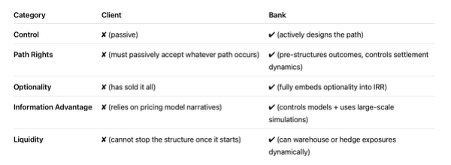
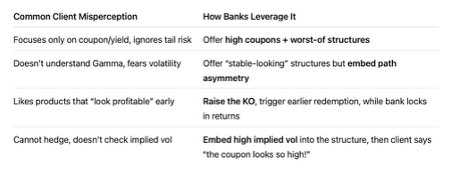
4.4 Who Wins What? Bank vs Buy-Side vs Retail
Loridy explained the asymmetry plainly.
Banks gain:
• Predictable downside vol flow
• Controllable Gamma/Vega exposure
• KO protects the upside risk
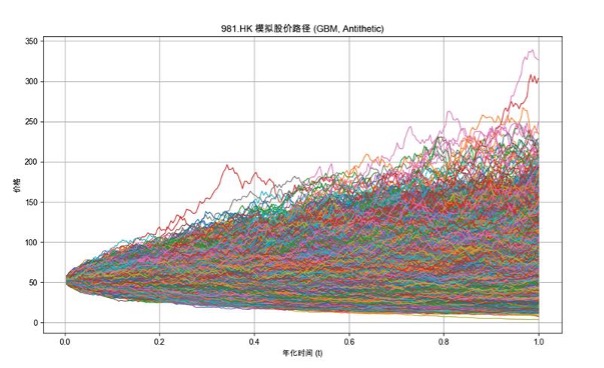
• Monte-Carlo helps fine-tune the strike & KO to shift risk toward the client
“Banks run thousands of simulated NVDA paths. They test which strike makes the structure ‘feel’ attractive while still giving them a favorable risk profile. Monte Carlo tells them how often KO happens, how fast quantities accumulate, and what kind of downside vol flow they’ll collect. The strike and KO you see are not guesses—they’re engineered.”
Buy-side institutions only touch AQ when:
1. They already want to accumulate NVDA at scale
2. They have hedging tools (options, futures, indices)
3. They treat AQ as a vol-harvesting tool, not a “discounted purchase”
Retail often misinterprets AQ as:
• Discounted buying
• Cost-efficient stock accumulation
• “Win-win if I like the stock long-term”
But in reality, AQ is:
• Forced averaging on the way down
• Leveraged downside (2× delivery)
• Capped upside once KO hits
“Very different from what most retail imagines,” Tom whispered.
V. Three Professional Insights Retail Must Understand
To keep things simple, Jerry asked:
“Okay, what are the three things every retail investor must know before ever touching AQ?”
Loridy raised three fingers.
5.1 AQ = Selling Volatility, Passively
Retail sees:
• “Buying NVDA at 95 instead of 100.”
Professionals see:
• “Selling large amounts of downside vol.”
Why does vol matter?
If NVDA drops from 100 to 85:
• Volatility spikes
• Short put losses explode
• Delivery doubles
• You buy more shares at prices above future lows
That’s the true risk.

5.2 Risk Accumulates Faster Than You Expect
Two hidden amplifiers:
1. Daily observation
2. Double delivery below strike
If NVDA stays between 93–95 for two weeks:
• You might buy 2000 * 10 = 20,000 shares
• Not because you wanted to
• But because the product forced you to
Your position can grow faster than your cashflow or risk appetite.
5.3 Path > Direction
This is the institutional mantra:
“Being right on the destination
doesn’t matter if the journey destroys you.”
If NVDA goes:
100 → 80 → 70 → 130
• Long-term view: correct
• AQ result: potentially devastating
Because:
• You accumulated heavily at 95–85–80
• Your average cost is high
• Your liquidity gets stretched
• And if KO never hits? Upside remains muted
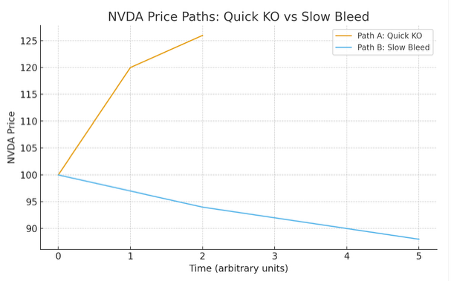
VI. Two NVDA Paths – A Simple Simulation by Loridy
Loridy gave two simple NVDA paths to illustrate.
1. Good Path – Quick KO
NVDA: 100 → 120 → 126
• KO triggers early
• Small number of shares bought
• Small profit
• Upside is cut
Outcome: modest win, limited exposure.
2. Bad Path – Slow Bleed
NVDA: 100 → 97 → 94 → 92 → 90 → 88
• Double delivery activates early
• Many days below strike
• Large position accumulates
• Average cost dragged upward
• Losses balloon as vol rises
Outcome: the classic AQ pain trade.
“Bad paths break investors more often than bad prices.”
VII. Final Takeaway – Loridy’s Advice to Retail Investors
Loridy closed with three points:
1. An Accumulator is not a discounted buy order.
It is a negative-Gamma, short-vol, path-dependent structure wrapped around the idea of gradual accumulation.
2. It fits only those with conviction, liquidity, and genuine risk capacity.
You must be prepared for:
o Large drawdowns before any recovery
o Rapid exposure growth during slow declines
o No upside if KO hits early
3. Upside is capped; downside is leveraged.
Success depends on understanding the structure—not hoping the market behaves.
She paused, then added a final nuance that often gets lost:
“Don’t demonize the Accumulator.
It can be a useful tool—if you truly understand what’s inside it.”
She explained:
• Adjusting the KO level can reshape the entire payoff profile
• Changing gearing or tenor can align the structure with your own risk tolerance
• But above all, the most important step is analyzing the underlying properly
“If you know the company well, understand the path risks,
and size the structure intelligently,
AQ can amplify a conviction—not replace it.”
She stood up, gathering her notes.
“Series 7 explained the Accumulator.
Series 8 explains the world it actually lives in.”
As the group absorbed her words, Ada whispered:
“Okay… I still like NVDA.
But now I know exactly what I’m signing up for.”
Loridy smiled.
“That’s all an investor really needs—clarity before commitment.”
