The AI Cycle and Inflation Path: Macro and Cross-Asset Strategy Research
Executive Summary
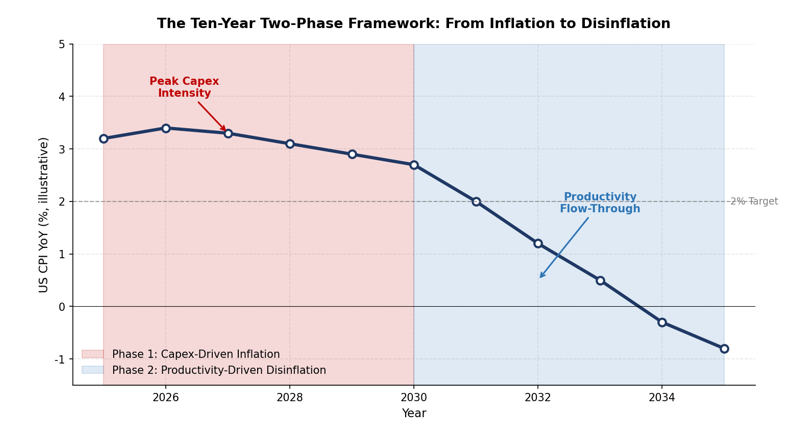
This report advances a central thesis: AI is no longer a marginal variable in the economy but a structural force reshaping the inflation path, profit distribution, capital flows, and asset pricing. We propose a ten-year two-phase framework—2025–2030 as the "capex-driven inflation phase" and 2031–2035 as the "productivity-driven disinflation phase"—and argue that the current market adjustment (rising real rates, pressure on long-duration bonds, resilient credit spreads, and strength in AI equities) represents the early stages of pricing this framework.
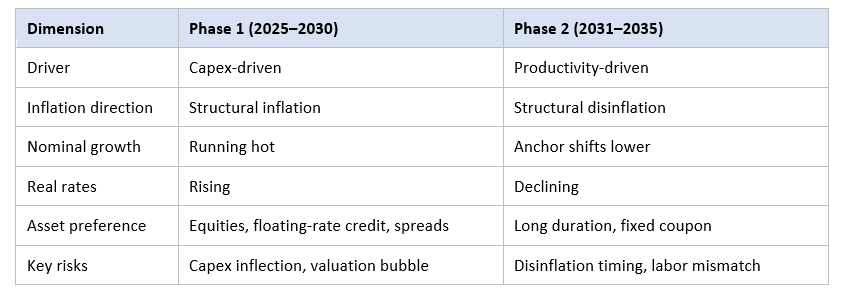
From this framework, we draw three principal conclusions. First, long-duration nominal assets will remain under pressure, and the rise in real rates is not yet complete. Second, floating-rate credit products and high-quality equities are the optimal vehicles for the current phase. Third, Japanese capital repatriation represents a low-probability but high-impact tail risk for the US Treasury market that should be incorporated into the risk budget.
1. Research Questions and Framework
1.1 Research Questions
The conventional macro framework treats AI as a productivity shock and, on that basis, predicts a unidirectional impact on inflation—long-term disinflation. However, this framework overlooks a critical fact: the capital investment required to realize AI's productivity dividend is itself an unprecedented inflationary shock.
This report addresses three progressive questions. First, what are the scale, composition, and time distribution of the AI capex cycle? Second, to what extent has this cycle already distorted inflation, profits, the labor compensation share, and the trade landscape? Third, how far has the market progressed in pricing this two-phase path, and what mispricings remain?
1.2 Analytical Framework
We use the "capex–inflation–rates–asset prices" transmission chain as our analytical backbone, decomposing the AI cycle into two phases:
2. Phase One: Capex-Driven Inflation
2.1 The Magnitude of the Capex Cycle
We project that the top five AI hyperscalers will reach $1.1 trillion in capex in 2026, equivalent to 3.3% of US GDP—a figure that will exceed projected US defense spending in the same year. Taking a broader view, we estimate global AI-related cumulative investment demand at over $90 trillion, spanning energy, data centers, water resources, copper, lithium, land, bandwidth, and grid infrastructure.
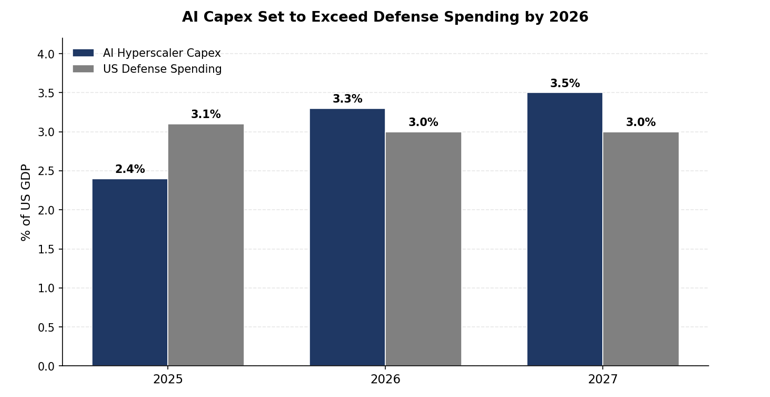
Together, these figures point to a single judgment: AI capex has reached a magnitude comparable to only a handful of major infrastructure cycles in history. Its pull-on factor prices—electricity, copper, uranium, water, land, advanced chips—is long-lasting and inelastic. This forms the microeconomic foundation of Phase One inflation.
2.2 Distortions Already Visible
The AI cycle's distortion of the real economy is now clearly visible across multiple data dimensions.
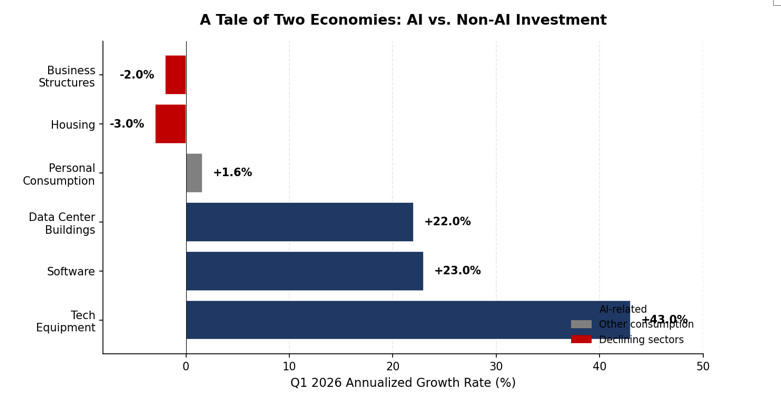
Bifurcation in GDP Composition
US real GDP grew at a 2% annualized rate in Q1 2026, but beneath the surface lies a bifurcation into two economies. Tech equipment investment rose 43%, software investment 23%, and data center construction 22%, while housing, business structures, and transportation equipment all declined, and personal consumption grew just 1.6%. Back-of-the-envelope calculations suggest the AI economy grew about 31% while the non-AI economy grew only 0.1%.
Our analysis suggests that, after netting out imports, gross semiconductor spending contributed only 0.4 percentage points to GDP (versus 1.7 points gross). This means the GDP impact of the AI cycle is significantly diluted by imports.
Reversal of Trade Patterns
AI hardware is heavily import-dependent—advanced semiconductors, HBM memory, specialized equipment—and is the core reason for the sharp rise in US imports and widening trade deficit in Q1. The mirror image is Taiwan's trade surplus reaching 24% of GDP and the South Korean KOSPI rising 78% YTD. This means tariff policy and the AI cycle are working at cross-purposes: the former aims to narrow the deficit, while the latter is systematically widening it.
The Capital-Labor Distribution Scale
S&P 500 Q1 earnings are forecast to grow 27% year-over-year, but the Magnificent Seven account for 61% growth while the remaining 493 firms grew just 16%. Meanwhile, Q1 labor compensation grew at only a 3.1% annualized rate, falling 0.5% in real terms after inflation. Labor's share of total business sector output fell to 54.1%, the lowest since records began in 1947.
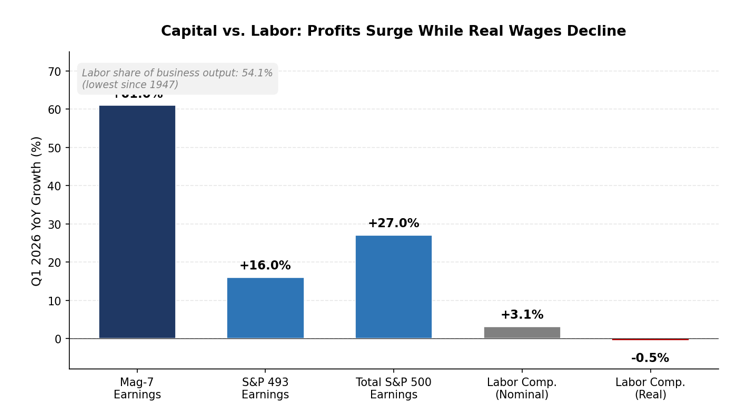
AI is systematically transferring economic rents from labor to capital and a small number of dominant firms. This distributional effect carries not only economic but also political implications—affecting regulatory paths, tax policy, and the midterm election landscape.
2.3 The Self-Reinforcing Wealth-Reinvestment Loop
The persistence of Phase One inflation derives from a self-reinforcing loop: AI capex drives up tech valuations and profits → US household wealth grows by approximately $15 trillion annually (on a $184 trillion base) → wealth effects support consumption and new AI, energy, and infrastructure investment → nominal growth remains elevated → which in turn reinforces the rationale for further AI capex.
We project US household wealth will rise from $184 trillion at end-2025 to approximately $214 trillion by end-2027. The key implication of this loop is: as long as the capex cycle does not experience an endogenous inflection, the "running hot" state of the nominal economy has the momentum to self-perpetuate. US nominal GDP grew 6.0% YoY in Q1 2026—a figure on par with the 50-year average that includes the high-inflation period of the late 1970s to early 1980s—offering direct evidence of this loop.
2.4 Pricing Progress: Real Rates, Not Inflation Expectations
A key observation: the current market adjustment is occurring primarily through rising real rates, not through a collapse in inflation expectations.
The 5y5y inflation swap remains anchored at 2.45%, the 10-year real yield holds near 2.0%, and the 10-year US Treasury nominal yield has broken above 4.60%. Technical analysis suggests further upside to the 4.55%–4.75% range is possible. Market expectations for the Fed path have shifted from pricing in roughly 9bps of cuts by year-end (a month ago) to pricing in 16bps of hikes. We have pushed our own two rate-cut forecast from September–October 2026 to July–September 2027.
The economic implication of this combination (stable inflation expectations + rising real rates + long-end breakout) is clear: markets accept the reality and persistence of AI capex but refuse to pay a premium for long-duration nominal assets.
3. Phase Two: Productivity-Driven Disinflation
3.1 Fundamental Reshaping of Cost Curves
The microeconomic foundation of Phase Two disinflation is AI's reshaping of cost curves across multiple critical industries. We highlight some of the most compelling cases: drug development cycles compressing from 10 years to 30 days with costs falling from billions to millions of dollars; millions of new materials discovered within weeks; the core cost components of batteries, agriculture, weather forecasting, and energy systems undergoing systematic reconstruction.
It is worth emphasizing that these are not marginal improvements but order-of-magnitude cost reductions. When these efficiencies begin to flow through to end prices in the early 2030s, the magnitude of the disinflationary shock may be comparable to the late-1990s internet cycle—or even the earlier electric revolution.
3.2 The Timing of Disinflation Transmission
Why 2031–2035? The timing of disinflation realization is constrained by three factors. First, AI capabilities must transmit step-by-step from the model layer to the application layer and ultimately to end-good and service prices. Second, the capex cycle must complete first—infrastructure must be built before efficiency dividends can be released. Third, the labor market needs time to absorb adjustment, given the billion-worker scale of the skill-redeployment process.
These three factors combined yield a 5–10 year transmission window, which underpins our 2031–2035 disinflation framework.
3.3 Markets Have Begun to Price It In
An often-overlooked fact: the very reason inflation expectations remain stable in a high-nominal-growth environment is that markets have already begun pricing in AI disinflation pressure for the 2030s. The 5y5y inflation swap's anchor at 2.45%—a level that is historically low for such a high-nominal-GDP environment—is itself evidence.
4. Cross-Asset Transmission and Allocation Implications
4.1 Rates and Bonds
The long end has not peaked. Under the combination of "nominal economy running hot + capex continuing + labor market not loosening," the long end of the nominal curve lacks a downside catalyst. We see the 10-year US Treasury yield rising into the 4.55%–4.75% range as our base case.
Japanese capital repatriation is a key tail risk. Japanese investors hold approximately $1 trillion in US Treasuries, the largest foreign holding in the world. The Japanese 10-year JGB yield rose this week to 2.73% (highest since May 1997), and the 30-year broke above 4% for the first time. Sentiment among major Japanese asset allocators has shifted noticeably, with several large institutional managers signaling that incremental funds will no longer flow into overseas bonds. Fund-flow data confirms the rotation: investors poured roughly $700 million into Japanese sovereign debt funds in March 2026, a record monthly inflow.
Yet it should be noted that over the past 12 months Japanese investors still net-purchased roughly $50 billion of foreign bonds—large-scale repatriation has not yet occurred. In our view, fiscal expansion under the Takaichi administration implies JGB supply-demand dynamics point to continued yield increases. This constitutes a low-probability but high-impact tail risk: once Japanese institutions begin systematic Treasury selling, the impact on the US Treasury supply-demand balance would be material.
4.2 Equities
AI theme: fundamentals solid, but short-term hedging warranted. The US AI Data Center basket has outperformed the Low-Income Discretionary basket by nearly 100 percentage points YTD. We remain constructive on the AI complex but recognize the market is entering a relatively catalyst-light window, and the asymmetry of holding unhedged exposure has deteriorated. In our view, short-dated downside protection on a broad AI basket is attractively priced at current implied volatility levels—a roughly 1-month, near-the-money put structure costs in the low-1.7% range, which we consider a reasonable premium to pay given the magnitude of YTD gains and the concentration risk embedded in current positioning.
Structural hedge: long AI, short low quality. Following the recent broad market sell-off, low-quality stocks' valuations have decoupled further from fundamentals, creating a natural short entry point. The attractiveness of this hedged pair lies in simultaneously betting on the reality of AI fundamentals and the unsustainable inflation of non-AI valuations.
Energy security: the highest-conviction non-AI direction. Within energy, we favor US domestic solar and European power as expressions of the broader energy-security theme. The former benefits from pre-midterm political focus on power prices; the latter, in our view, offers a rare combination of low positioning crowding alongside earnings revision breadth running at historical highs.
Consumer: do not press the short. Sub-sectors such as low-income discretionary and middle-income discretionary have cumulatively underperformed the S&P 500 by 10–15 percentage points YTD; short positioning is crowded, and any short-term earnings beat could trigger a squeeze.
4.3 Credit and Floating Rate
Floating rate over duration. In Phase One, floating-rate credit products—BB-rated CLOs, leveraged loans, agency MBS floating-rate CMOs—offer a structural advantage over duration assets: they capture credit quality improvement from a strong nominal economy while avoiding duration losses from rising real rates.
Within the long-duration track: Municipality and IG over Treasuries. For investors required to hold duration exposure, long-duration municipal bonds and investment-grade credit are more attractive than Treasuries because the former do not depend on falling rates to deliver excess returns via spread compression.
Spreads have room to compress further. The 2026 HY spread peak (335bps) is notably below the 2025 peak (435bps), and occurred earlier, reflecting the Trump administration's reduced tolerance for market risk as the midterms approach.
5. Risk Scenarios
We identify three scenarios that would challenge our core conclusions.
Scenario 1: AI capex cycle peaks early. If hyperscalers begin showing "destocking" signals in H2 2026 or 2027—slowing orders, declining utilization, deteriorating unit economics—the Phase One inflation logic faces a fundamental challenge. In this scenario, the price recovery of long-duration assets could occur far earlier than consensus, with AI equities and floating-rate products coming under simultaneous pressure.
Scenario 2: Japanese capital repatriation accelerates. If Japanese institutions shift from the current "trickle" to systematic selling, the $1 trillion potential supply overhang would materially impact Treasury yields. In this scenario, yen appreciation would proceed slowly at first and then sharply, with broad valuation pressure across global dollar assets.
Scenario 3: Phase Two disinflation arrives earlier than expected. If the transmission speed of AI's productivity dividend exceeds the 5–10 year baseline assumption (e.g., mass AI Agent adoption in 2028–2029), an earlier disinflationary shock would shift long-duration assets from compressed to advantaged. The Nasdaq 100's recent 25%+ surge over six weeks is, in our view, a tentative early signal that the transition may be moving faster than previously expected.
6. Conclusion
AI plays two roles simultaneously: an inflation driver for the next five years and a disinflation engineer for the five after that. This is not a cyclical tech rotation but a civilizational restructuring with the potential to rewrite cost structures, labor markets, and the financial system.
For investors, three judgments are crucial. First, Phase One is not yet over—long-duration nominal assets will remain under pressure, with floating-rate credit and quality equities as preferred vehicles. Second, AI thematic fundamentals are real and credible, but short-term valuations and positioning require hedging protection. Third, the cross-phase inflection points—the capex peak, the timing of disinflation realization, and the pace of Japanese repatriation—are the most important tail risks to monitor over the next 12–24 months.
More pressing than directional judgment is the capability to construct positions for both phases simultaneously: participating in the Phase One inflation dividend while preserving room to position for the Phase Two disinflation pivot.
