Built to Double, Bound to Bleed: The Paradox of Leveraged ETFs

In early July 2026, an AI-chip unwind rippled from Seoul to Silicon Valley. Korea’s KOSPI fell nearly 10% intraday and tripped its circuit breakers; Micron shed about 13% in a session, erasing roughly $38 billion; Intel dropped some 21% over seven trading days. The strangest tell came from Korea, where Samsung posted a record quarterly profit and its shares still fell about 7%. In a crowded, leveraged tape, price is driven as much by positioning as by earnings.
Nowhere was that clearer than in one Hong Kong-listed fund. The CSOP SK Hynix Daily (2×) Leveraged Product (7709.HK) launched in October 2025 at about HK$7.8 and rode SK Hynix’s roughly 900% run to extraordinary size: by May 2026 it had overtaken the Direxion Tesla 2× fund to become the world’s largest single-stock leveraged ETF, and at its peak — around US$17 billion — it was briefly the largest ETF of any kind listed in Hong Kong, bigger than the fund that tracks the entire Hang Seng. Then, in the July unwind, it fell about 27% in a single day and roughly 46% in a month — more than halving from its peak.
How can a product built to deliver twice a great company’s return instead lose half its value, while the company is still a winner in the AI-memory boom? The answer lies not in the stock, but in the machinery of the ETF itself.
1. The product in one sentence: a daily multiple, not a holding-period multiple
A leveraged ETF seeks to deliver a stated multiple of the underlying asset’s daily return, before fees, financing costs, transaction costs and tracking frictions. For a 2x SK Hynix-linked ETF, the target is roughly two times the daily move: if the stock is up 3% today, the ETF is designed to be up about 6%; if it is down 3%, the ETF is designed to be down about 6%.
The critical word is “daily.” The product does not promise twice the underlying’s return over one month, six months or a year — its mechanism is to reset exposure back to the stated leverage ratio at the close of every trading day. Any return over a holding period longer than one day is therefore path-dependent. To understand this, let’s explain the mechanism first.
2. How it actually works
1) What’s inside: a total return swap
Leveraged products obtain exposure through combinations of swaps, futures, options, cash collateral. For most cases, it holds cash and Treasury bills as collateral and enters a total return swap(TRS) with a bank, with a notional equal to twice its net asset value. Under the swap the fund receives the total return on that notional — roughly $200 of SK Hynix for every $100 of investor money — and pays the bank a financing rate plus a fee. The bank on the other side hedges by holding the actual stock or futures.
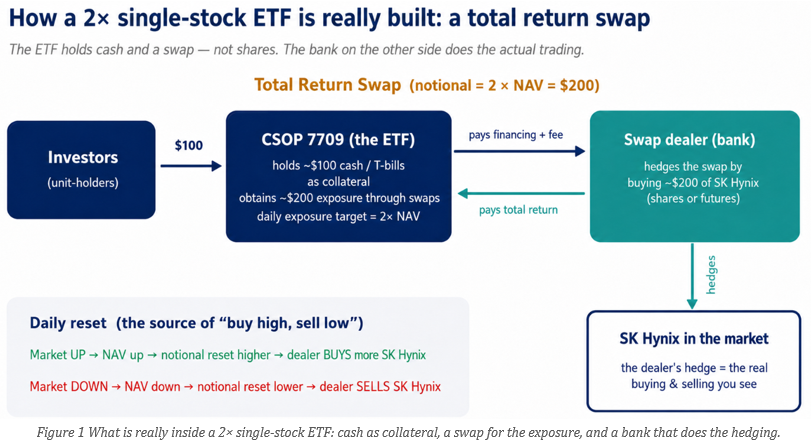
For 7709 the plumbing is expensive: exposure comes mainly through swaps topped up with options (the ceiling was lifted to 49% of NAV on 23 June), and CSOP has disclosed that instrument costs can consume up to 40% of NAV a year, with a daily tracking difference around −0.30%. That carry is a headwind before any market move.
2) The daily reset forces “buy high, sell low”
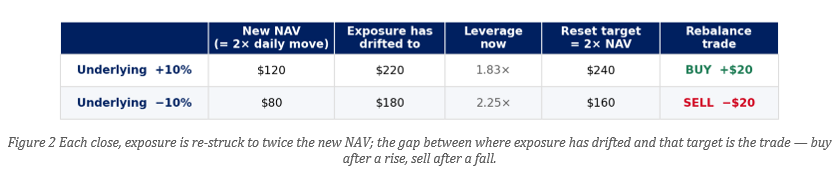
To keep exposure at exactly twice NAV, the fund must trade at every close, always in the direction the market just moved. Start a 2× fund with $100 of NAV and $200 of exposure. If the underlying rises 10%, NAV climbs to $120, but the exposure has drifted to $220 against a new target of $240 — so the fund must buy $20 more. If it falls 10%, NAV drops to $80, exposure sits at $180 against a target of $160, and the fund must sell $20. Up days force buying; down days force selling.
The size of that trade is exact. For leverage L, a start-of-day NAV and a daily return r, the fund must trade:

It is always in the direction of the move, proportional to the move, and scales with L(L−1) — so a 3× fund rebalances three times as hard as a 2×.
3) Volatility decay and convexity
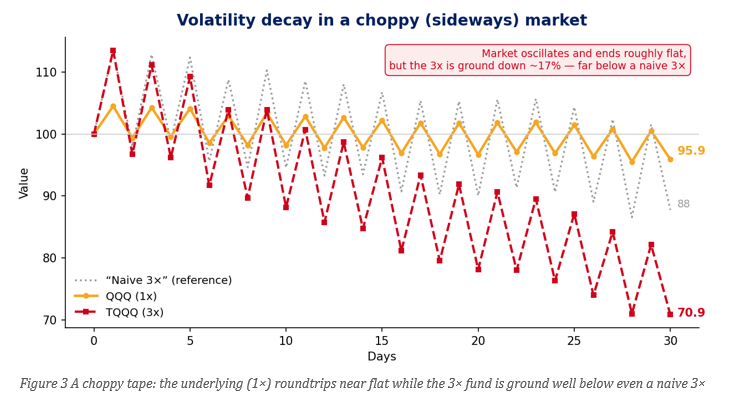
That forced roundtripping has a price, and it is not a fee — it is mathematics. Every up-then-down cycle has the fund buying high and selling low. The loss compounds, so in a choppy, sideways market the underlying can end almost exactly where it began while the leveraged fund is ground steadily lower. The drag grows with the square of volatility and scales with L(L−1):

where σ is the underlying’s volatility — so a 3× fund decays roughly three times as fast as a 2×, and doubling volatility quadruples the drag.
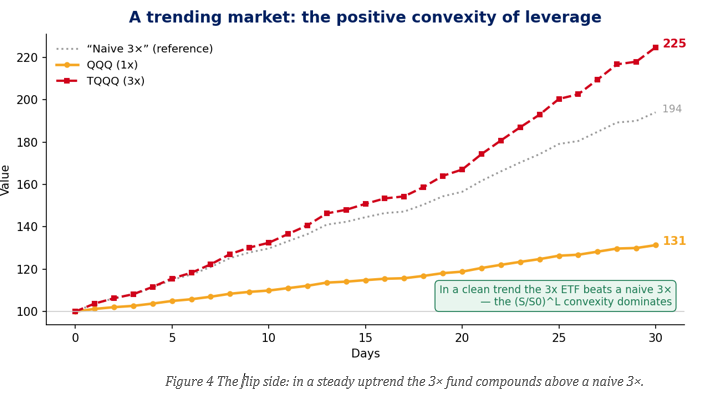
In the language of options, a leveraged ETF is long delta — its exposure is a multiple of the underlying — and its daily reset makes that exposure rise after gains and fall after losses. In a clean, one-directional trend this creates convexity: gains compound on a growing base, and a 2× or 3× fund can beat a naive multiple of the index. But the same reset leaves the compounded return negatively exposed to realised variance — economically like being short a variance swap — so repeated reversals produce a volatility drag that scales with σ². Financing and fees add a further negative carry on top. Leverage, in short, is convex to trend and taxed by volatility: which effect wins depends on whether the move is stronger than the noise around it.
If this sounds like a derivatives exam, don't worry — the intuition is much simpler than the vocabulary. Figures 3 and 4 show these two forces using the Nasdaq-100 (QQQ) and its 3× daily leveraged fund (TQQQ). Figure 3 is the "taxed by volatility" case: the index chops around but ends the month where it began — QQQ is flat, yet TQQQ has bled lower, because every fall shrinks the base the next rise must rebuild, so the round-trips cost money even though the index went nowhere. Figure 4 is the "convex to trend" mirror image: QQQ grinds steadily higher, the compounding now works in your favour, and TQQQ finishes above three times QQQ's return. In general, A leveraged ETF rewards a smooth trend and punishes a choppy one, so what matters is not whether the underlying rises, but how straight the path is.
4) Why the “average” misleads and lognormality matters
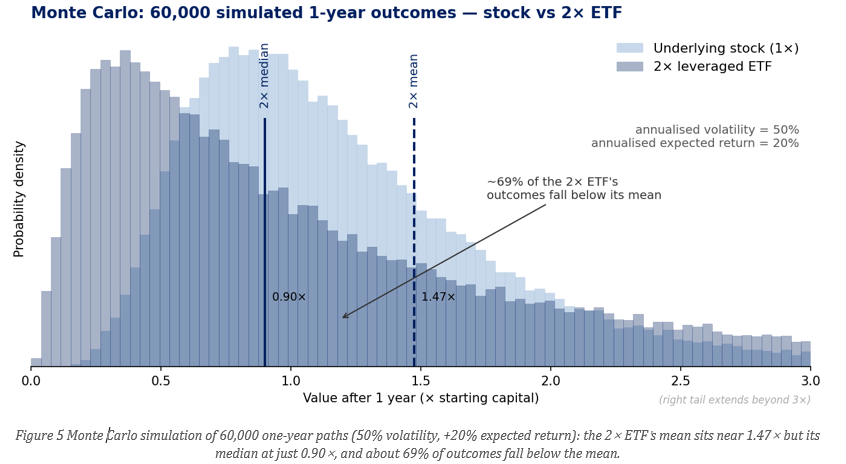
For a leveraged ETF the advertised "average" return is a poor guide to what you are likely to get. Because returns compound multiplicatively, the distribution is lognormal — bounded at zero on the downside but with a long right tail. Investors should examine the median outcome, probability of loss and downside tail alongside the expected value. The median — the geometric, compounded return — and it always sits lower, by a gap that widens with leverage, volatility and time.
The cleanest way to see the problem is to simulate it. Take a 2× fund on a stock expected to return 20% a year with SK Hynix-like swings (about 50% annualized volatility), and model the range of one-year outcomes. Two very different numbers come out. The average is 1.47× ( a 47% gain) but that figure is a mirage, propped up by a lucky minority of paths that trended smoothly higher and dragged the arithmetic mean far to the right. The median — the middle of the range, with a 50/50 chance either side — is just 0.9 (a 10% loss). About two-thirds of outcomes land below the "average," and more than half lose money outright, even though the stock itself is expected to rise 20%.
3. The dealer’s secret
Return to the swap. The bank hedges its exposure and stays broadly flat on direction; its economics come from two sources. First, it charges the fund a financing rate on the leveraged portion of the notional — in effect funding the extra ~$100 of exposure for every $100 of NAV — and earns the spread between that rate and its own cost of funds. Second, an explicit swap fee is written into the terms. Because the fund's rebalancing is mechanical, daily, and known in advance — buy after a rise, sell after a fall — the dealer can anticipate the flow and hedge it efficiently, which is why what looks like a risky derivative to the buyer is, for the dealer, a relatively steady stream of financing and fees.
The fund sponsor is compensated separately, through a management fee — about 1.6% a year for 7709 — and, because the exposure is assembled from swaps and options rather than held outright, the fund discloses that instrument costs can reach up to 40% of NAV a year, with a daily tracking difference of around −0.30%. Taken together, these are the recurring costs of running the product: the financing spread and swap fee accruing to the bank, and the management fee and instrument costs to the sponsor.
4. Korea: when the tail wags the market
Korea shows what happens when this mechanism reaches systemic scale. Samsung Electronics and SK Hynix together are more than half of the KOSPI, and after a 2026 rule change opened the door to single-stock leverage, the country's leveraged-ETF complex ballooned to roughly US$40 billion — about 2.6% of free float — held overwhelmingly by retail.
Because those two names are the index, the forced end-of-day rebalancing lands squarely on them: on a 5% move, estimated dealer hedging flows run on the order of US$2.0 billion in SK Hynix and US$1.45 billion in Samsung, roughly a quarter and a fifth of each stock's daily volume.
Such flows may amplify an existing sell-off. The strain is visible: program-trading sidecars were triggered 32 times through early July, more than in all of 2008, and three-month implied volatility jumped to around 80% from about 20% a year earlier.
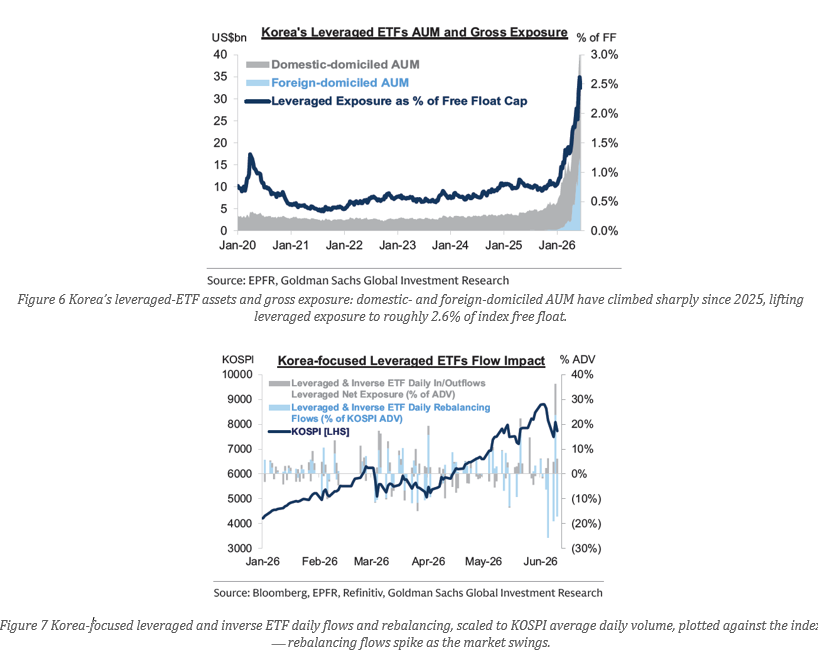
Around 70% of the complex's growth since 2025 was return-driven rather than new buying, so the leverage built up passively as the rally ran and now unwinds pro-cyclically on the way down. And close to half of the notional sits in foreign-domiciled products — Hong Kong's 7709, US-listed funds — so the exposure simply changes time zone when Seoul closes, and much of it is invisible to any domestic-only rule.
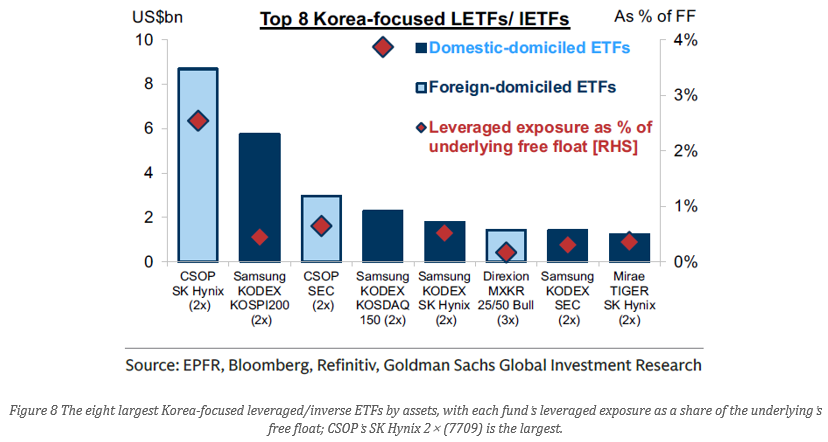
The policy response has been swift. Korea had effectively banned these products for years before loosening the rules in 2026 to keep money from leaking offshore; regulators warned on the eve of launch that they were "unsuitable for long-term investment," and the head of the Financial Supervisory Service later said he "deeply regretted" not stopping them. Officials are now weighing tighter liquidity-provider oversight, stronger suitability rules, and even delisting — though the funds may be too liquid to remove. The deeper problem is that any curb applies only to domestic products, so it risks pushing the same demand to Hong Kong or New York. When a country's own central bank and regulator both flag a product as destabilizing the market, the plumbing itself has become a risk factor.
5. So… How to use them
Leveraged ETFs are legitimate instruments for the right job. They are built and marketed as short-term, tactical tools, and that is how they should be used.
Reasonable uses:
• Short-term tactical trades measured in days to a few weeks.
• Expressing a clear, high-conviction directional view, or capturing a strong one-way trend — where the convexity can work in your favour.
• Gaining exposure or hedging with less capital committed.
Poor uses:
• Buy-and-hold or core allocations — longer holding periods increase path dependence and cumulative costs.
• High-volatility single stocks and “set and forget” — the higher the volatility, leverage and horizon, the greater the risk of erosion. A 2× on a 50%-volatility stock behaves like a full-risk, ~100%-volatility position with built-in decay
One caution specific to the SK Hynix complex: the new US-listed 2× funds on the Nasdaq ADR (for example SKHU, SKUU and SKHL) track the ADR, whose price is discovered in Seoul while New York is closed — layering overnight-gap risk, an ADR premium or discount, and won-dollar currency risk on top of the leverage, exposures a same-market fund never had. And 7709’s own price spent much of its run at a premium to NAV; when that premium collapsed, latecomers lost twice — once as the stock fell, and again as the premium unwound.
6. Bottom line
A leveraged ETF is a double-edged sword, not a buy-and-hold vehicle. It rewards a short, clean, correct directional call and punishes time and volatility with equal precision. The right question before buying one is not “am I right on direction?” but “is my directional view stronger than the stock’s realized volatility, and will I be out before the daily churn eats the position?” 7709 did not halve because SK Hynix stopped being central to the AI-memory story; it halved because a daily-reset 2× machine, in a violent tape, does exactly what its mathematics require — and its own size helped make the tape violent. Understand the machinery, and the risky double that doesn’t multiply by two stops being a paradox and becomes a tool you can use on purpose.
The story is always moving on. With SK Hynix now listed as a US ADR, some investors are choosing the underlying itself over the leveraged wrapper — money is draining out of 7709 and into the ADR. It is a telling migration: given the choice, a good part of the money would rather simply own SK Hynix than rent a geared bet on it.

