2026 H2 Global Economic Outlook (I) — US

After the Fog — Holding the Line
US Summary — The Trade We Made, and the One We're Keeping
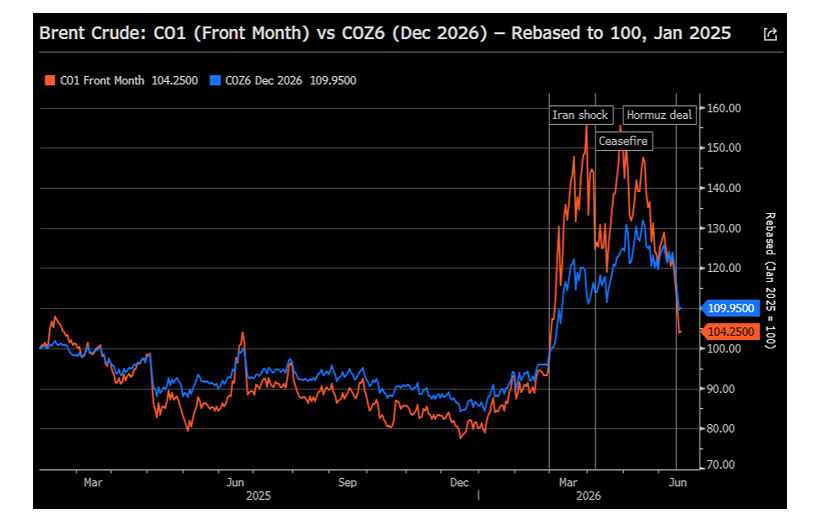
Three months ago, with Brent above $112, the Nasdaq down seven of eight weeks, and gold suffering its worst drawdown since 2013, we wrote that the fog of war would clear—and that the assets sold indiscriminately into the Iran shock would reprice sharply when the liquidity gets better. That call has paid. Over the weekend of June 13–14, the US and Iran reached an interim agreement: an immediate ceasefire, the reopening of the Strait of Hormuz, partial sanctions relief, and a 60-day window for further talks. Brent is back to roughly $79. The S&P 500 has recovered to ~7,510, up about 9% on the year and within a whisker of all-time highs. Gold did not die; it sits near $4,326, up more than 30% over twelve months. The credit carry we recommended at 66–75bp has compressed back to the tights at ~50bps.
So we begin H2 with an uncomfortable luxury: most of what we liked is no longer cheap. The central question is no longer whether to buy the dislocation—it is what edge remains once the catalyst we forecast has arrived and been priced. Our answer is that the second-order trade is now the more important one. The market has repriced the Fed from 'cutting' to 'hiking'—and, after the hawkish Warsh debut, to a full hike priced by October—and that is the misprice we will fade. The dollar's structural drivers are turning. And under the surface of a 21x, record-ROE index sits the most extreme mega-cap concentration since the 1960s. H2 is not about chasing beta. It is about holding our highest-conviction macro line—the next Fed move is not a hike—while rotating out of the crowd and paying up for optionality into a calendar stacked with September and December dot plots, a September 30 funding cliff, and the November 3 midterms.
We stay constructive. But we are changing how we are long: the front end over duration, cash credit over synthetic carry, gold as a debasement position rather than a hedge, and the broad market and the bottlenecks rather than the mega-caps. Before we lay out each book, the ledger.
Scorecard — What We Got Right and Wrong
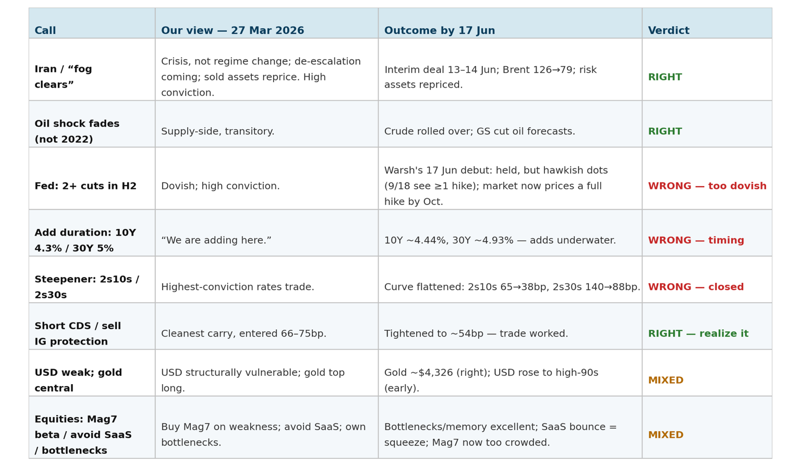
In our Q2 outlook we made eight US calls. The honest accounting is strong on direction and on the things that mattered most, with one clear miss we want to confront directly rather than bury.
1. “The fog of war will clear.” Status: Right, and it was the call of the quarter. We argued Iran was a one-off crisis, not a regime shift, and that Trump could not enter the midterm cycle with $100 oil. The interim deal arrived almost exactly along the escalation-then-de-escalation path we described. Brent fell from above $120 to ~$79; the assets sold into the panic repriced.
2. Oil shock is supply-side and fades; we are not in 2022. Status: Right. Crude has rolled over and many sell side banks have since cut its oil forecasts. More on the inflation read below—the backtests are emphatic here.
3. Fed: two or more cuts in H2. Status: Wrong—too dovish. We were early and directionally off: with Warsh's first FOMC and the inflation up, the market briefly reversed and gradually priced in hikes. We are revising the call, not doubling down. Our new base case is an extended hold—and we think the market's flirtation with hikes is the real misprice.
4. Add duration at 10Y 4.3% / 30Y 5%. Status: Wrong on timing. Yields kept rising—the 10Y is ~4.45% and the 30Y ~4.90%—so the adds are underwater. The front end is now the cleaner expression of the Fed call, and the 30-year add only triggers above 5%
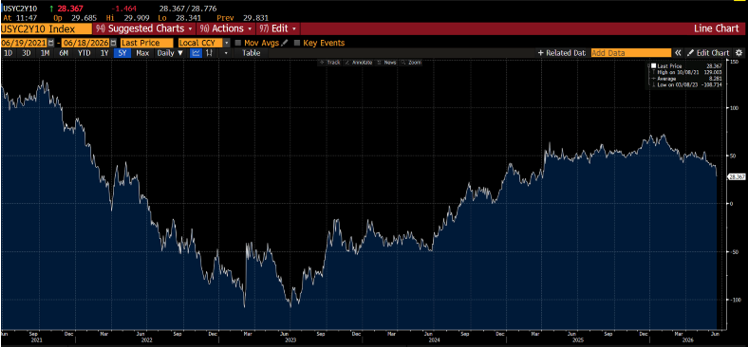
5. Steepener (2s10s, 2s30s). Status: Wrong—we are closing it. We called the curve steeper; it did the opposite. The 2s10s flattened from ~65bp to 38bp and the 2s30s from ~140bp to 88bp through the shock. Here is the honest mechanism: a steepener needs the front end to rally, but the market repriced the Fed toward hikes on Warsh, so the 2-year rose; meanwhile the de-escalation pulled the inflation premium out of the long end. Both legs flattened the curve—the front end rose faster than the long end. And the backtests expose the deeper error: oil-shock steepeners are cut-driven (the front end collapses because the Fed eases), and we are forecasting a hold, not cuts. We stand the trade down and re-specify rates around the front end.
6. Short CDS / sell IG protection for carry. Status: Right—now realize it. CDX IG has compressed back to ~50bps, near YTD tights. The trade worked; the carry-and-compression is largely spent. We are taking the win.
7. USD structurally vulnerable; gold central. Status: Right on gold; the USD call is a longer fuse. Gold is ~$4,326—the drawdown we called mechanical proved exactly that. On the dollar we were early and, near-term, plain wrong on direction: DXY is in the high-90s and actually strengthened through the shock on safe-haven flows and energy driven inflation. The structural-vulnerability thesis is intact but it is a 6–12 month view, not a Q2 one—we will closely monitor the progress.
8. Equities: Mag7 as beta, avoid long-only SaaS, own the bottlenecks. Status: Mixed—bottlenecks excellent. Memory and the AI supply chain were the standout (contract DRAM +20–30% QoQ; SNDK above $2,000). “Avoid SaaS” was early—software bounced—but we read that bounce as a short squeeze, not a thesis change, and we hold the line. The one we are changing is “Mag7 as beta”: at today's regime, we no longer want them as our market exposure.
Fed & Liquidity — The Hike Is Mispriced
Today's meeting (18 June) is the place to plant the flag. Warsh's debut FOMC held at 3.50–3.75% but delivered a hawkish surprise: 9 of 18 officials now pencil at least one hike this year, the 2-year jumped ~15bp to 4.19%, and fed funds futures price a full hike by October (roughly 40% odds on July). Our single highest-conviction macro view for H2 is that this is the misprice—the next move from the Warsh Fed is not a hike. And read the meeting closely: the hawkishness is borrowed, not owned. It came from the committee's dot distribution and Warsh's inflation-first rhetoric, not from Warsh himself, who pointedly withheld his own dot and refused all forward guidance—his personal reaction function is opaque by design. Our base case is an extended hold through year-end; we were too dovish in March, but we are not capitulating to the hawks now. The data on the bar to hike is, frankly, lopsided in our favor.
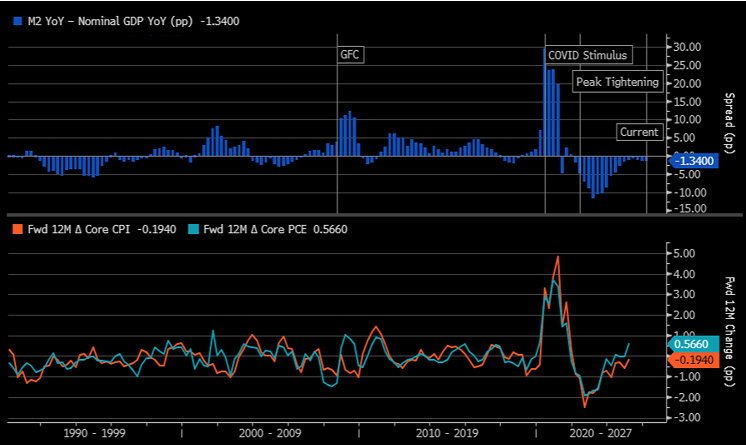
We ran the conditions present at the start of every Fed hiking cycle since 1990 and put 2026 alongside them. The result is striking. 2026 would be the only cycle in the sample where the Fed hiked with unemployment essentially at NAIRU (4.3% vs a 4.4% estimate), with real GDP running at or below potential (Q1 +1.6%; Q2 tracking ~+2.2%, with domestic final sales just +1.6%), and with wage growth contained at +3.6%. Compare 1999 (output gap +3.1%, real GDP +4.7%) or 2022 (core PCE 5.6%, wages 5.9%, nominal GDP +11%). Every prior hiking cycle was launched into demonstrable overheating, monetary excess, or both. Today there is neither. M2 is growing 4.7%, below nominal GDP—the money supply is not feeding a demand boom.
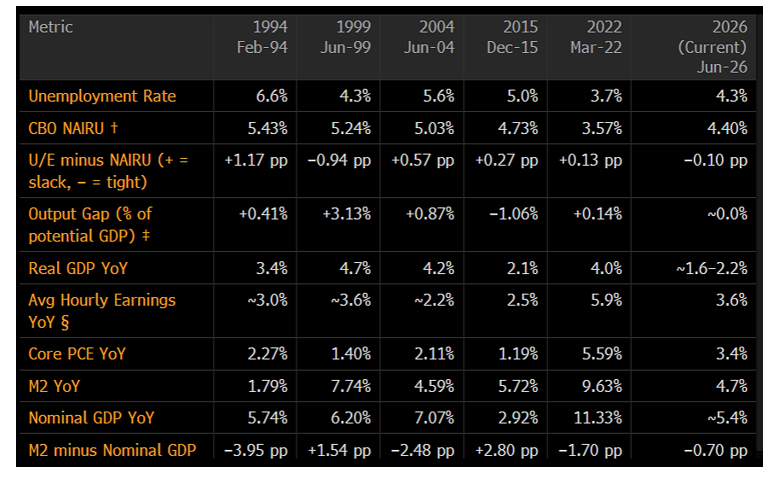
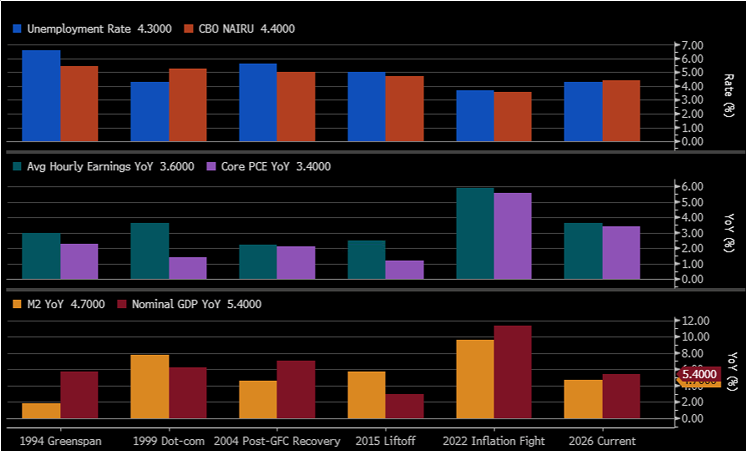
We are not naïve about the one hawkish exhibit. Core PCE at ~3.4% is the second-highest reading at any hiking-cycle start in our sample, behind only 2022. A hawk will point at it. Our rebuttal is the nature of the inflation, not its level: this is cost-push (oil plus an AI-hardware import-price impulse—May consensus core PCE of +0.31% m/m, +3.38% y/y, was lifted by a 39.7% y/y surge in imported computer-parts prices), set against an economy with no demand overheating. That is a supply-side problem, and you do not solve a supply-side price shock by hiking into a labor market that is already balanced and a consumer whose real final demand is running 1.6%.
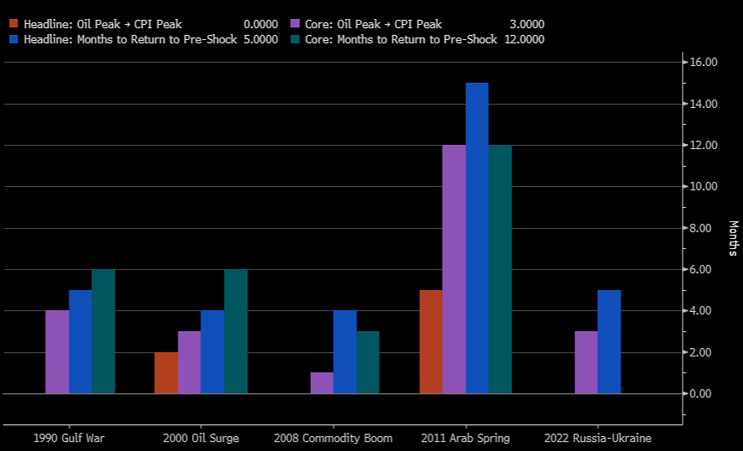
And the supply-side impulse is already rolling over. Our oil-to-CPI episode work (1990, 2000, 2008, 2011, 2022) shows headline CPI peaks 0–2 months after the Brent peak and reverts to its pre-shock rate within roughly 4–7 months; core lags ~4.6 months and follows. With Brent's high now well behind us, the arithmetic points to headline rolling over through H2 and core following with the usual lag. The monetary backdrop agrees: when M2 growth runs below nominal GDP—as it has for seventeen straight quarters, the longest tight-money stretch in our data—forward 12-month core PCE falls 71.6% of the time (correlation +0.67). The signal is “mild” at the current –1.3pp spread, not extreme, so we are honest that this is a tailwind to disinflation, not a guarantee of a fast return to 2%. But the direction is not in question.
Layer the politics on top. Warsh is read as a hawk, but Trump chose him into a midterm year, and an administration that cannot afford tighter financial conditions before November has every incentive to ensure the floor under policy is “no hikes.” We do not need Warsh to be dovish. We need him not to hike—and the economics and the politics both point the same way from our perspective despite the hawkish June dot plot (while Warsh himself did not submit his own dot plot forecast). On liquidity, Warsh opened his term by standing up a task force to review the $6.7tn balance sheet—a quantitative-tightening tell—so he is unlikely to proactively re-expand it absent funding stress. That keeps term premium structurally firmer in the near term, but the discipline it signals is, to us, a long-term positive: it reinforces the credibility of US monetary policy and, with it, the standing of Treasuries and the dollar. It is also why we keep this view purely at the front end, where the misprice lives, rather than dressing it up as a curve trade.
The trigger we will watch: two to three months of declining headline CPI as energy normalizes. When the market's hike pricing unwinds toward our hold, the front end rallies—and that, not the curve, is where we are positioned.
Rates — Fade the Front-End Hike; Duration Only at 5%
We are simplifying the rates book to a single high-conviction idea and dropping the trade we got wrong. Last quarter we ran a steepener, and the curve flattened on us—2s10s to 38bp, 2s30s to 88bp. Across the five oil-supply shocks since 1990, four resolved into a bull steepener—but in every one the engine was the Fed cutting hard, with the 2-year collapsing a median 249bp into recession or the zero bound. The lone shock met by a Fed that held or hiked into sticky inflation—2022—bear-flattened 112bp, and today's hawkish FOMC flattened our curve further still (the 2-year +15bp, the 10-year barely moved). We are forecasting a hold, not cuts. So we do not have the cut-driven engine that historically steepens the curve, and we are standing the steepener down rather than averaging into it a third time.
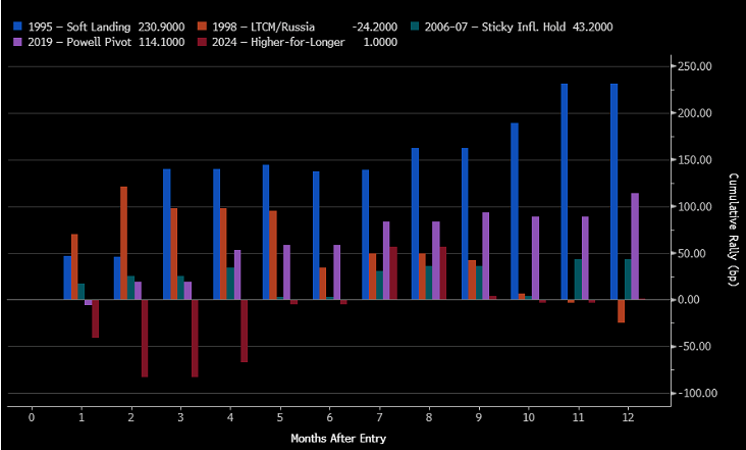
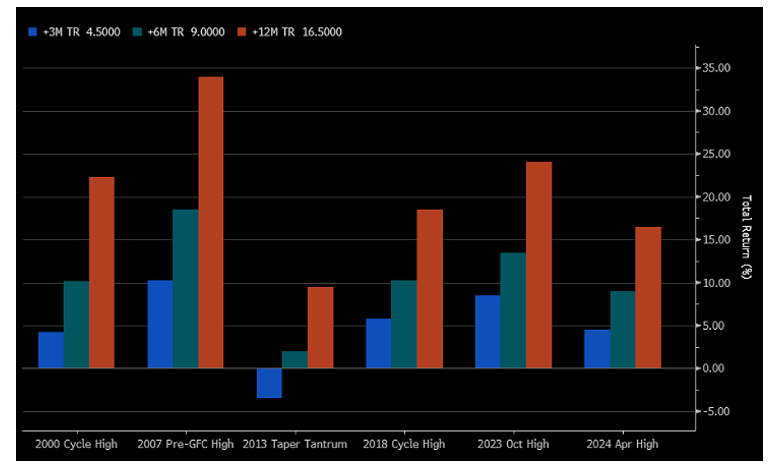
Our edge is narrower and cleaner: the front end is pricing hikes that will not happen. We position for that directly—receiving the 2-year, and the December SOFR contracts that embed the hike premium—rather than bundling it with a long-end view the disinflation is currently fighting. The base rate is strong: when the market has priced Fed hikes that failed to materialize (1995, 1998, 2006–07, 2019, 2024), the 2-year has rallied in every episode, a median 71bp at three months and 101bp at twelve. But we are deliberate about the target. Our base case is a hold, not an easing cycle, so we are positioned for the roughly 25–40bp of hike premium to come out of the 2-year—not for a full cut-driven rally. Post-today's meeting the 2-year sits at ~4.19%, pricing a full hike by October—the richest the front end has been to our hold, and our entry. This is the same engine as our soft-dollar view (US 2-year down, the differential compresses), so the book lines up behind one thesis instead of three loosely-related ones.
We respect the analog that looks most like us. In 2006–07 the Fed held for a year with inflation sticky, and the 2-year barely moved—down just 14bp over twelve months—while the curve stayed flat. That is the honest risk to the front-end trade: if Warsh holds but core inflation refuses to fall, we earn carry and little capital gain. We accept the asymmetry because the downside is small (the front end is already rich to a hold) and the payoff is the hike premium unwinding—but we size it as a conviction expression of the Fed call, not a levered duration bet.
Outright duration is a separate, disciplined trade. Our March 'add at 4.3%' was early; we won't average down at 4.9%. We're honest that the historical '5%+' signal is regime-contaminated — most of those observations are the 1990s–2000s bond bull, and in the modern regime the level has barely occurred — so we treat 5% not as a high-probability statistic but as a value anchor and a carry cushion: above 5%, the running yield finally compensates for the tail, and with ~18–20y duration a further 50bp still costs ~9–10%. Hence the discipline — add above 5%, not before; front-end as the core, the long-end add as defined and opportunistic.
Credit — Take the Carry, Rotate to Cash
In March, CDX IG at 66–75bp was the cleanest carry in a late-cycle book, and short protection worked beautifully—spreads ground back to ~54bp. We are now booking that as a realized win and changing the expression, because the math at the tights has inverted.
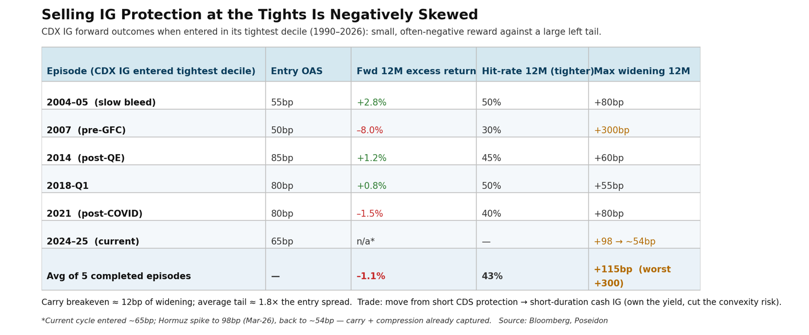
Selling IG protection here is a negatively skewed trade. Our work on CDX IG in its tightest decile shows that, historically, selling protection at these levels generated negative excess returns at twelve months (about –1.1%, with only a 43% hit rate), and the breakeven is razor-thin—roughly 12bp of widening wipes out the carry, while the tail (1.8x the entry spread in average max-widening, and the 2007 blow-out) is uncompensated. The supply story reinforces the caution: large-cap issuance, much of it debt-financed AI capex, keeps building, and at some threshold the market prices that. We are not there yet—spreads can grind—but we would rather own the yield with less convexity risk. So we move from short CDS protection into short-duration cash IG: capture the all-in yield, keep the spread-duration low (the index has crept to ~4.6 years), and avoid the unlimited mark-to-market of synthetic carry at the tights.
FX & Gold — A Dollar Rich on Borrowed Premium; Gold Is a Trade, Not a Hedge
The honest starting point on the dollar is that it has been strong, not weak. DXY sits in the high-90s (~97.5 on the futures, ~99.6 spot), it is up on the year, and it rose through the Iran shock. That is exactly what the history predicts: an oil-supply shock hands the dollar a safe-haven and terms-of-trade bid, because it punishes energy-importer currencies—the euro and the yen—far more than the US. So the question for H2 is not the level but its composition. Decomposed against a front-end fair-value model, roughly 1.0–1.5 points of today's index is residual geopolitical premium (down from a 2.5–3.0 point peak in March–April), which leaves the dollar about one standard deviation rich to a rate-implied fair value near 96.
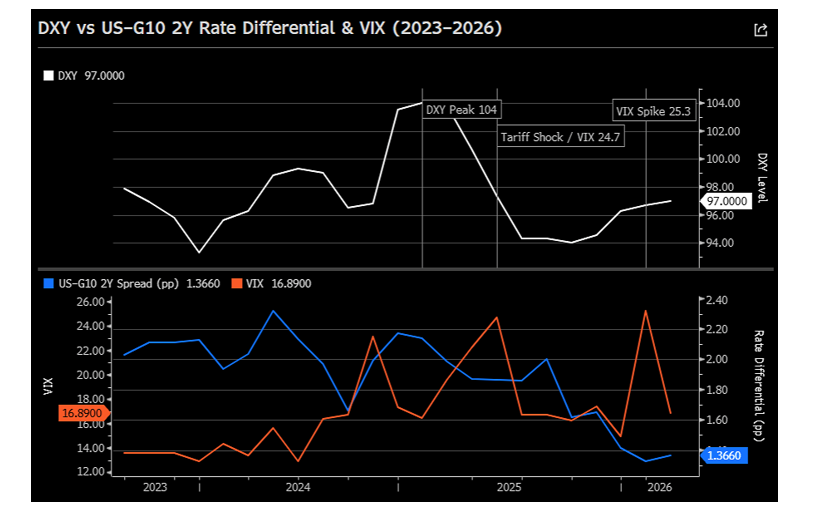
The rest of the level is rate-differential support—and here is the observation that matters for our book: that support is borrowed from the very misprice we are fading. The dollar's June leg higher came as the US 2-year repriced on Warsh hike fears, widening the US–G10 2-year spread back to ~145bp from a ~105bp April trough. If we are right that the Fed holds and the hike pricing unwinds, the US 2-year falls, the spread compresses, and the dollar's structural bid weakens. In plain terms: short dollar is the FX expression of our Fed call—the same trade through the rate-differential channel, not an independent diversifier, and we size it as such.
We are therefore not short the dollar here. Near-term it stays bid—the first month after a settling oil shock is historically still firm, and Hormuz is not yet fully open. Today proved the point: the hawkish FOMC sent the dollar to its best day since March and the yen to its weakest since July 2024—precisely the borrowed, hike-driven premium we expect to unwind. But the path is down. As the geopolitical premium unwinds toward fair value (~96) and the hike pricing fades through H2, we lean for a drift into the mid-90s, with 93 an extension target that requires the foreign leg to deliver—further unexpected BoJ hikes and a euro/yen terms-of-trade recovery as Hormuz normalizes. We express this not through outright DXY but through short USD versus the energy-vulnerable-importer recoveries—the euro now, and the yen in Part II—where the terms-of-trade tailwind compounds the rate story. It is a medium-conviction, multi-month view, run as a lever on our Fed thesis rather than as additive risk.
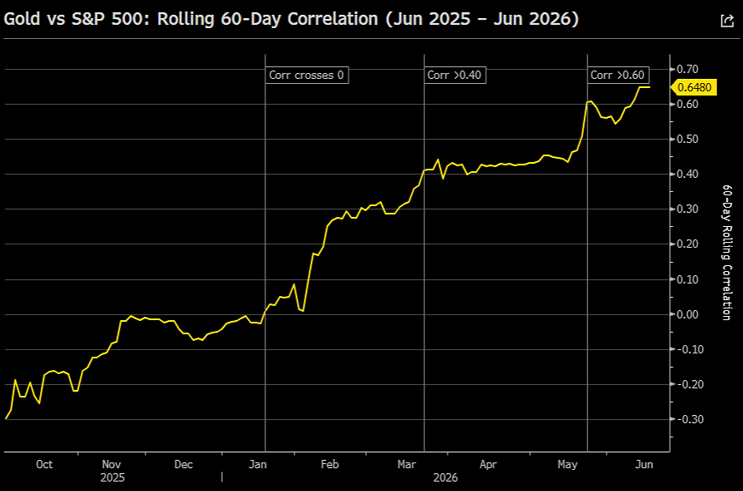
Gold is the independent leg, and it is where we want to be most precise, because its character has changed. We remain structural longs and we add on dips—the base rate is supportive: after a >30% trailing-twelve-month rally (we are at +31%), gold's forward six-month return has averaged +16.7% with a 75–80% hit rate. But we are explicit about what kind of position this is. Gold is no longer behaving as a hedge. Its 60-day correlation to the S&P has flipped from –0.30 last autumn to +0.65 today (on display today, when gold fell 2.6% intraday alongside equities on the hawkish dots before recovering to ~$4,300 on the Iran peace-deal signing); its beta to the dollar has tripled to –2.33; and its sensitivity to real yields has collapsed to roughly zero (10Y TIPS at 1.9% and gold still at record highs). Translated: gold is now a USD-debasement and momentum trade, powered by central-bank buying and de-dollarization, not a rates-driven safe haven. Two implications follow. First, the bull case does not require the dollar to fall—gold has been rising alongside a firm dollar this year, so our soft-dollar path is a bonus (at a –2.33 beta) rather than a precondition; the trade stands on its own central-bank and debasement legs. Second, the risk-management caveat: do not size gold as portfolio insurance, because with a +0.65 equity correlation it will not cushion an equity drawdown, and the modern-era 12-month hit rate fades toward a coin flip beyond six months. We own it as a debasement position, sized accordingly.
Equities — Risk-On, but Not the Mega-Caps
We stay net long equities. The earnings backdrop is intact, oil is falling (our framework implies ~+4% upside to global equities as Brent normalizes toward $80), “Sell in May” is a debunked signal, and the catalyst path favors risk through the recovery. But we are changing the vehicle, and we are buying protection, because the index's internals are the most lopsided in two generations.
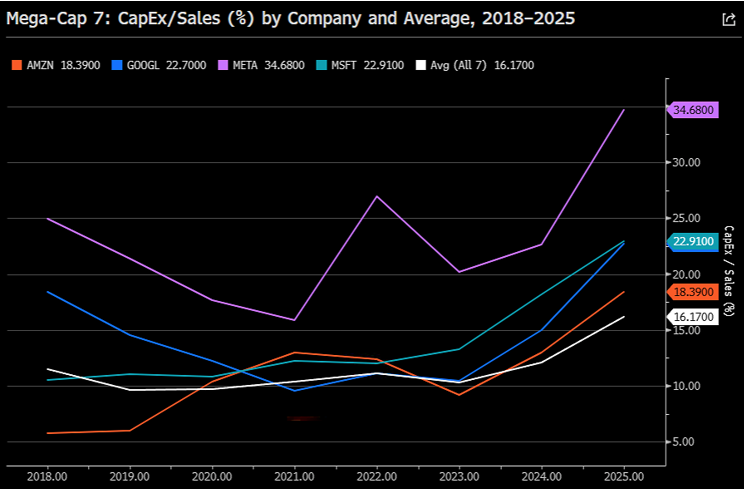
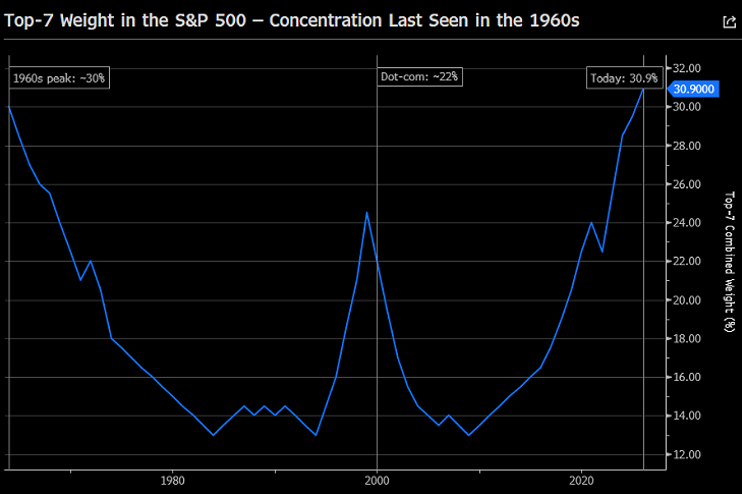
We are stepping away from the Mag7 as our beta. This is a change from March, and the data forces it. The top-7 are 30.9% of the S&P—roughly $22.6T of a $73T index—a concentration last seen in the mid-1960s, and the cap-weight/equal-weight ratio is at an all-time high. Our concentration backtest is the tell: at these extremes momentum persists near-term (the cap-weighted index still edges equal-weight at 3–6 months), but the twelve-month edge collapses to ~+1.5pp, the lowest of any regime, and equal-weight has already begun to outperform in 2026 YTD. The risk here is rotation and de-rating, not a crash—which is exactly why we'd rather express the market through the broadening (equal-weight and the bottlenecks) than through names trading at a 23% cap-weight premium (92nd percentile) with capex/sales at a record 16% (20%+ for the hyperscalers). The 2023 analog is instructive in reverse: META's “Year of Efficiency” drove the largest single-stock re-rating in our data up; if cloud revenue keeps growing only gradually while capex climbs, the same market reprices the group down toward discipline. We don't need to short them. We just don't want them as our long.
On AI more broadly, our view is two-sided and, we think, correctly humble. The technology trajectory is not in doubt: the scaling laws across pre-training, post-training, inference-time compute, and recursive self-improvement are still compounding, frontier labs report that the large majority of their code is now model-written, and iteration cycles have compressed to roughly two months. The medium-term picture is genuinely optimistic. But the stocks have already priced an enormous amount of it—the AI complex implies north of $1.1tn of hyperscaler capex in 2027, approaching 3.5% of US GDP, and the coding/agent monetization ramp is largely in the numbers. After a rocket-like move, the risk-reward has compressed even if the direction has not. That is the definition of a position you keep but hedge.
So our equity book for H2 is:
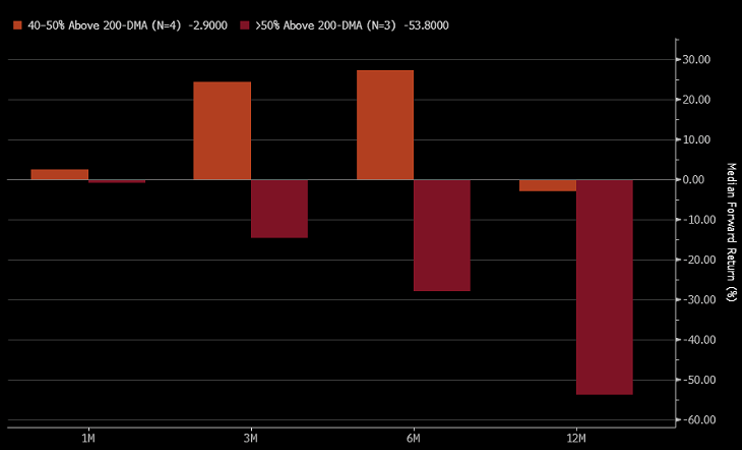
Long the bottlenecks—our highest-conviction equity theme, kept but hedged. The semiconductor cycle still has room: revenue is outgrowing inventory, and our cycle work points to semis rising over the next twelve months on quarterly revenue growth holding above 60% y/y, memory-led. Contract DRAM is up 20–30% q/q and NAND ~30%. We stay long memory, and the physical choke points around it—MLCC, ABF and T-glass substrates, advanced packaging, CPO, InP, and the power/energy complex feeding the data-center build. But the SOX is now +58.7% above its 200-day moving average, the most stretched since 1999–2000, when comparable extensions gave back 35–55% over the following 6–12 months. We are not blind to that. We carry the longs with explicit hedges—MTUM and semiconductor put structures, which screen cheap relative to the realized move—so we own the upside of a real, revenue-generating cycle while paying for insurance against a momentum unwind.
Express the market through the broadening, not the mega-caps—equal-weight and the under-owned cyclicals where earnings-revision breadth is still rising, rather than the top of the index.
Continue to avoid long-only SaaS. We were early, and software squeezed higher, but we are unconvinced. Near-term, agentic AI is a headwind to traditional subscription software—when an agent performs the task the tool automates, pricing power erodes—and we read the rebound as a positioning-driven short squeeze rather than a fundamental re-rating. The eventual survivors embed AI natively and become the platform layer; until that separation is visible in the numbers, broad long-only SaaS is a poor risk-reward.
Summary — Holding the Line
The trade we made in March—buy the dislocation because the fog would clear—has paid, and the temptation now is to keep chasing the same longs. We are doing something harder: holding our most contrarian macro view while changing how we are positioned. The view is that the next Fed move is not a hike, that the market's drift toward hike pricing is the misprice of H2, and that no hiking cycle in the last thirty-five years began with growth this soft, a labor market this balanced, and wages this contained. We monetize that at the front end—receiving the 2-year for the ~25–40bp of hike premium to unwind, having stood down the steepener that the data showed was a cut-driven trade we had no business running into a hold—with a disciplined long-bond add reserved for 30Y above 5%. We bank the credit carry and rotate into short-duration cash IG. We treat the dollar as rich on borrowed premium—not short it here, but leaning for a drift from the high-90s toward the mid-90s as the Iran premium and the hike pricing unwind, expressed short USD versus the euro and yen as the FX leg of our Fed call—and we own gold as a debasement trade, not a hedge, sized for what it has become. We stay net long equities but out of the mega-caps, expressing the tape through the broadening and the bottlenecks, with the memory complex hedged against its own 1999-style stretch.
H2 is a market that will reward conviction and punish reflexive trend-following into a calendar loaded with two dot-plot FOMCs, a funding cliff, and the midterms. The fog cleared. Our job now is to hold the line where we have an edge—and to stop being long the consensus where we don't.
Next week we will publish Part II, covering China and Japan, where the same shock leaves a very different set of trades—most pointedly a long-yen position whose catalyst (a BoJ now at 1.00%) has finally arrived while the currency sits at 160. Stay tuned.
