AI Token Futures: The Commoditization of Compute and the Reinvention of Product Design
.png)
Executive Summary
We are witnessing the emergence of a new commodity class. AI inference tokens — once a mere billing unit — are structurally evolving into tradeable compute raw materials, analogous in nature to electricity or carbon credits. At the same time, the energy infrastructure underpinning this compute is under unprecedented strain. Together, we sketch a world in which compute is priced like a commodity, hedged like an energy contract, and constrained by the physical limits of power grids.
I. Tokens as Commodities : The Economic Logic
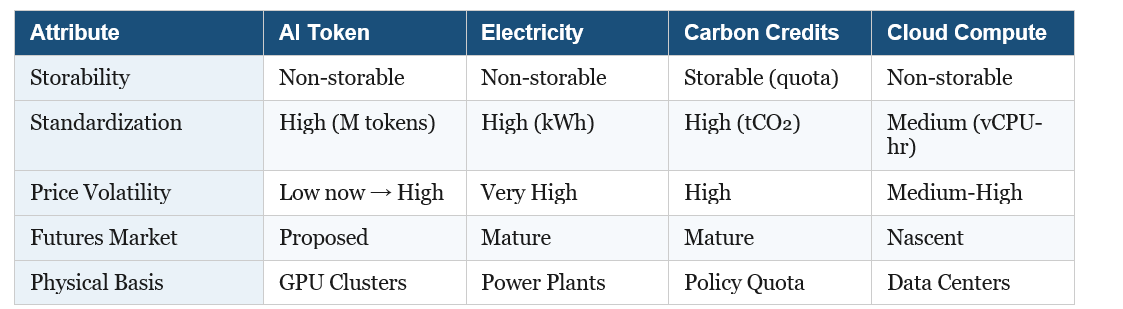
The token — the fundamental unit of large language model inference — has undergone a quiet but profound transformation. From a technical measure of compute work to an economic concept, it now exhibits the hallmarks of a tradeable commodity: fungibility, standardized measurement, and sufficient market scale.
On fungibility: when an enterprise sends an inference request to an AI model, it cares about output quality and latency, not which specific GPU generated the token. Tokens of equivalent capability from OpenAI, Anthropic, Google, and open-source providers are functionally interchangeable — much as WTI and Brent crude differ in quality but this does not prevent oil futures markets from functioning. On standardization: "per million tokens" pricing has become a universal industry convention, analogous to electricity measured in kWh or natural gas in MMBtu. On market scale: the global AI inference API market exceeded $10 billion in annual volume in 2024, growing at over 100% annually — comparable in size to early-stage carbon emission trading markets.

The most illuminating parallel is electricity. Like electrons, tokens are non-storable: inference compute is produced and consumed simultaneously, with no concept of "token inventory." This non-storability is precisely what makes price risk management both essential and difficult — there is no buffer to absorb demand shocks.
Tokens also exhibit a distinctive dual nature. From the consumer perspective, they are a finished product — users purchase AI-generated answers. From an enterprise perspective they are a raw material input — an AI SaaS company must "consume" tokens to produce its own value-added services. As vision-language-action (VLA) models penetrate manufacturing, logistics, and healthcare, the raw material attribute will gradually dominate. This mirrors electricity's historical arc: from a "novel product" in the 1890s to indispensable "infrastructure input" by mid-twentieth century.
II. Price Dynamics: From Collapse to Volatility
Token prices have fallen dramatically — from approximately $60 per million output tokens in early 2023 to under $1.50 by early 2025, a more than 40-fold decline driven by three overlapping forces: hardware upgrades (A100 → H100 → B200 GPUs ->....), algorithmic efficiency gains (Mixture-of-Experts architectures, quantization), and intense competition from numerous new entrants triggering price wars.
However, this price collapse is a transitional phase, not a permanent equilibrium. Three distinct price eras can be identified:
• Phase 1 (2023–2025): Supply-driven decline. All three supply factors improve simultaneously; competitors price below marginal cost to acquire market share, sustaining an artificial buyer's market.
• Phase 2 (2025–2027E): Rebalancing. Application-layer deployment accelerates; data center construction cycles (18–36 months) and chip lead times cannot keep pace. Price decline slows; intermittent rebounds emerge.
• Phase 3 (post-2027E): Demand-driven volatility. VLA models and embodied AI drive explosive token demand. Supply expansion is constrained by physical infrastructure timelines, producing price spikes analogous to electricity market "price peaks."
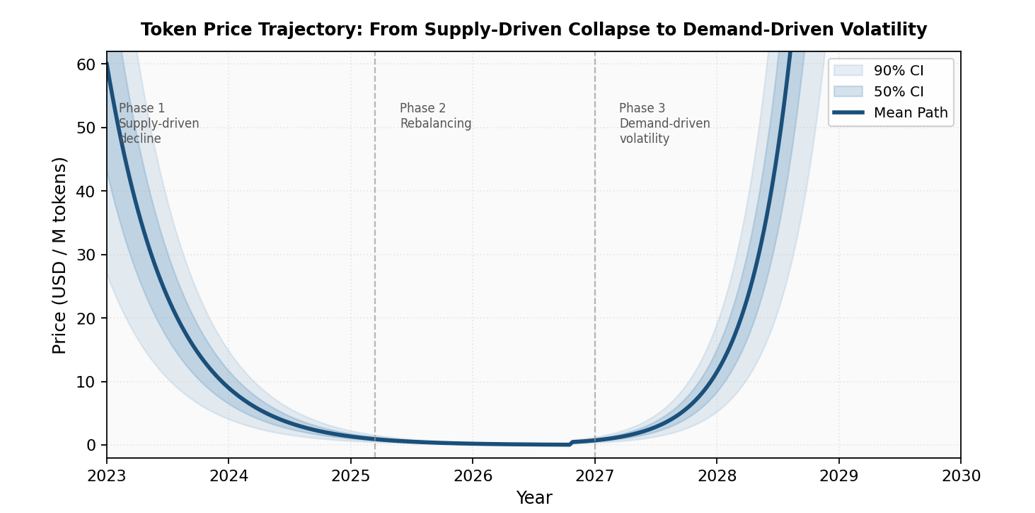
The structural driver of this transition is the asymmetric timescales of supply and demand. Token demand can surge near-instantaneously — a viral application can multiply API call volume tenfold within days. Supply expansion, by contrast, is anchored to the physical world: wafer capacity expansions require ~24 months; data center construction takes 18–36 months; power infrastructure upgrades may take a decade or more. Monte Carlo simulation across 10,000 price paths confirms that approximately 15% of scenarios involve at least one price increase exceeding 100% within 36 months.
III. The Energy Constraint: Infrastructure Under Siege
Energy cost sits at the core of token supply capacity. And the evidence that this constraint is tightening is now unambiguous.
In 2024, global data center electricity consumption reached approximately 415 TWh — about 1.5% of total world electricity use — growing at a compound annual rate of 12% since 2017, more than four times the rate of total global electricity growth. The IEA's base case projects this reaching 945 TWh by 2030 and climbing further toward 1,200 TWh by 2035. A single advanced generative AI query already consumes roughly ten times more electricity than a conventional web search; newer, more efficient models have reduced median text query energy to approximately 0.24–0.3 Wh, though long reasoning or multimodal prompts remain substantially higher.

The geographic concentration of this constraint is acute. Northern Virginia hosts the world's highest density of data centers, yet local utilities have struggled to build transmission capacity fast enough, triggering warnings and connection delays. Ireland's data centers already account for over 21% of national electricity demand, potentially reaching 30% by the early 2030s; the country's energy regulator now requires new applicants to demonstrate on-site generation capabilities. The Netherlands implemented a nine-month moratorium on new hyperscale data center permits. In mature European and North American markets, the average wait time for a large-scale grid connection now ranges from 7 to 10 years, with some projects facing delays of up to 13 years.
The IEA estimates that nearly 20% of planned data center projects globally could face significant delays due to grid connection challenges alone — a direct supply constraint that will amplify the price volatility predicted by the three-phase model above.
A critical tension runs through the efficiency narrative. One major hyperscaler reported that between May 2024 and May 2025, it reduced median energy per AI prompt by a factor of 33 — yet its absolute data center electricity consumption still grew 27% year-over-year. This is the Jevons Paradox: efficiency gains lower per-unit cost, stimulate greater adoption, and ultimately increase total consumption. It is precisely why the IEA projects data center electricity demand will more than double by 2030 despite anticipated efficiency improvements. Per-token costs will fall; total token consumption will rise faster.
IV. Token Futures: Contract Design and Hedging Logic
Against this backdrop — structural supply constraints, impending price volatility, and no existing risk management instruments — a complete token futures contract architecture can be designed. The core is the Standard Inference Token (SIT): a quality-adjusted unit benchmarked to established frontier model performance thresholds (MMLU ≥ 86%, HumanEval ≥ 67%, GSM8K ≥ 92%). The design logic mirrors crude oil futures, where "API gravity" and "sulfur content" standards allow oil from different origins to trade under a unified contract.
Key contract specifications include: a contract size of 1 million SIT per lot; USD denomination; six consecutive monthly contracts plus four nearest quarterly contracts; 24-hour continuous trading; and cash settlement against a Token Price Index (TPI) — a volume-weighted average price across qualified providers, with a 30% single-provider weight cap to prevent market manipulation.
The hedging mathematics are compelling. Under the classical minimum-variance framework, the optimal hedge ratio is h* = ρSF × (σS / σF). With a spot-futures correlation of 0.85, hedge efficiency reaches 72.25%, meaning token futures eliminate approximately 72% of cost variance for a fully hedged enterprise buyer.
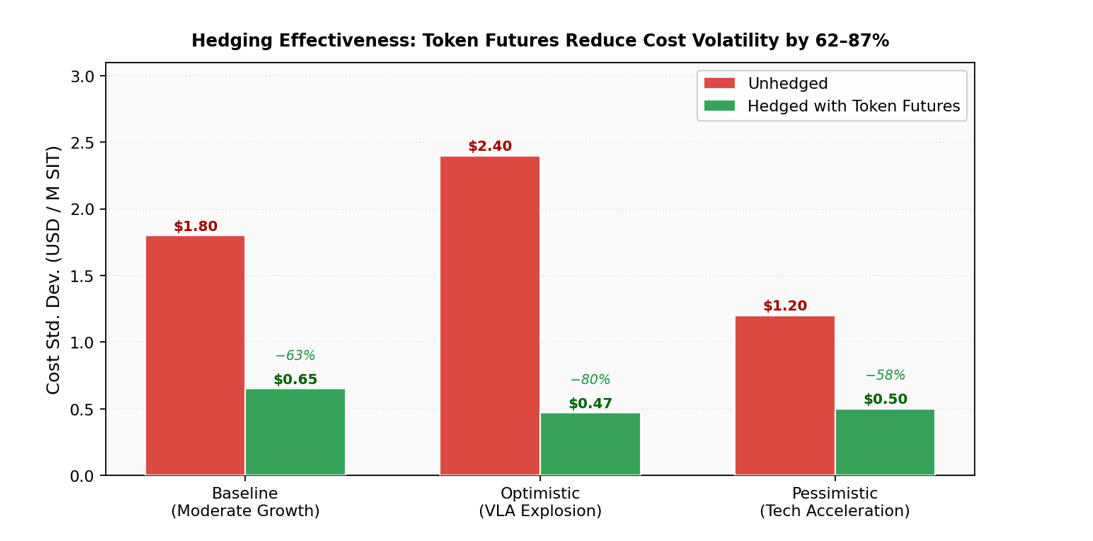
Monte Carlo simulation confirms this hedging value is robust across scenarios. Under the baseline scenario, optimal-ratio hedging compresses the 12-month procurement cost standard deviation from $1.80 to $0.65 per million SIT — an 87% variance reduction. Even under the pessimistic scenario (accelerated technology progress reducing prices), efficiency remains at 78%. Across all three scenarios, token futures reduce enterprise compute cost volatility by 62–87%.
The market structure accommodates three participant types: hedgers (AI SaaS companies seeking cost certainty; model providers locking in revenue); speculators (quantitative funds exploiting mean-reversion and jump dynamics); and arbitrageurs (ensuring price consistency across platforms and maturities). Each plays a distinct and necessary role in a functional market.
V. Regulatory and Governance Dimensions
Both domains examined here — token markets and AI energy — face analogous governance gaps: the instruments exist in outline but lack enforcement, standardization, or credible measurement.
On the financial regulation side, token futures are most appropriately classified as commodity derivatives rather than financial securities, given their real physical basis: every token generated consumes quantifiable electricity and GPU compute. This distinction fundamentally separates token futures from cryptocurrency futures. Token prices are anchored by production costs (a price floor) and application marginal utility (a ceiling), making speculative detachment from fundamentals structurally unlikely. Under the US regulatory system, CFTC jurisdiction is the appropriate framework.
On the energy disclosure side, the governance landscape is more fragmented. Frameworks exist — updated OECD AI Principles (2024), the G7 Hiroshima Process International Code of Conduct, UNESCO's AI Ethics Recommendation, the EU AI Act's energy transparency requirements — but most remain voluntary or non-binding and lack enforceable metrics. Corporate disclosures are inconsistent: some companies report only inference, omitting training; others use median rather than mean consumption figures; market-based versus location-based emissions accounting rules produce incomparable results across organizations.
A recent high-profile case illustrates the cost of this gap. When a Chinese AI laboratory claimed to have trained a major reasoning model for approximately $294,000, the figure was widely reported as evidence that frontier model training costs had collapsed. Subsequent analysis revealed the number covered only the final reinforcement learning stage, excluding the far more compute-intensive pre-training of the base model, which used thousands of GPUs over two months. When full training stages and infrastructure costs are included, the effective energy and cost are comparable to other large-scale systems. Without standardized full-lifecycle disclosure requirements, such misrepresentations — intentional or not — will recur.
Conclusion
The commoditization of AI compute is not a distant prospect — it is underway. Tokens already exhibit sufficient fungibility, standardization, and market scale to support futures trading. The question is not whether, but when. The optimal launch window for a token futures market is estimated at 2027–2028, when application-layer demand explosion will have materially reshaped supply-demand structure and price volatility will have become genuinely two-directional.
Three structural forces will define the intervening years. First, energy constraints will tighten before they ease: grid interconnection delays of 7–10 years mean that data center capacity decisions made today will not translate into compute supply until the mid-2030s. Second, demand will continue to accelerate: the commercialization of VLA models in autonomous driving, industrial robotics, and medical diagnosis will create large pools of price-inelastic token demand, analogous to industrial electricity consumers in power markets. Third, the information architecture of compute markets will mature: TPI infrastructure, energy disclosure standards, and regulatory frameworks are all converging.
The deepest insight across both analyses may be this: AI compute is following electricity's historical arc — from novel service to indispensable infrastructure — but on a compressed timeline. Electricity required roughly 60 years to make this transition. Tokens may complete it in under a decade. The institutions of commodity finance — futures markets, standardized contracts, margin systems, regulatory oversight — exist precisely for this moment of infrastructure maturation.
The compute economy is arriving. The question is whether its financial and governance architecture will keep pace.
