2026 Q2 Global Economic Outlook (II) — China & Japan - Two Economies, Two Fragilities
Review of China Q1 2026 — The NPC Delivered Exactly What We Expected
In our last quarterly update, we wrote that Chinese policymakers remained “unwilling to make substantial changes” to the structural imbalance between excess supply and deficient demand. Three months later, the National People’s Congress has confirmed this assessment in the clearest possible terms. Beijing’s 2026 GDP growth target was set at 4.5–5.0%, the lowest since the early 1990s. The fiscal deficit ratio was held at approximately 4% of GDP, with ultra-long special treasury bonds at ¥1.3 trillion and local government special bonds at ¥4.4 trillion—both flat year-on-year. The broader fiscal package, once all instruments are included, reaches approximately ¥12 trillion, a number that looks large in isolation but represents no incremental expansion from 2025.
The message is unmistakable: stability over stimulus. There are no consumption voucher programmes, no large-scale property bailout, and no pivot toward household balance sheet repair. The supply-side orientation of fiscal policy remains firmly intact, and with it, the structural dynamics that have kept China in a low-nominal-growth equilibrium for the past two years.
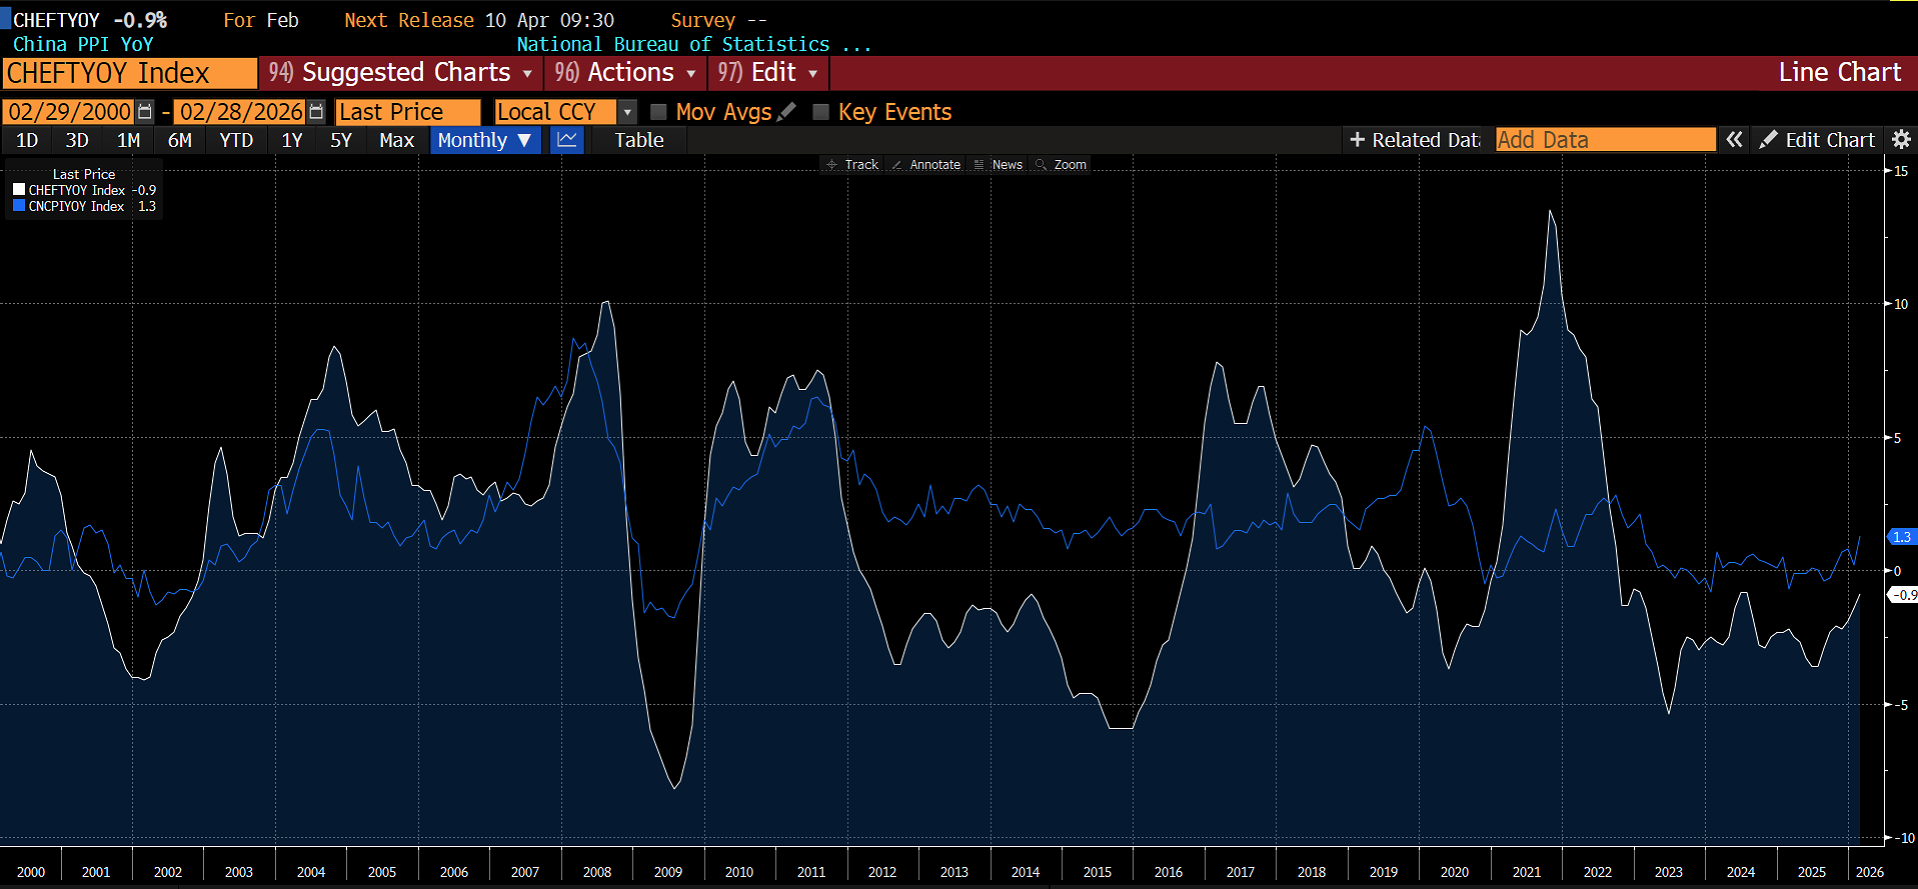
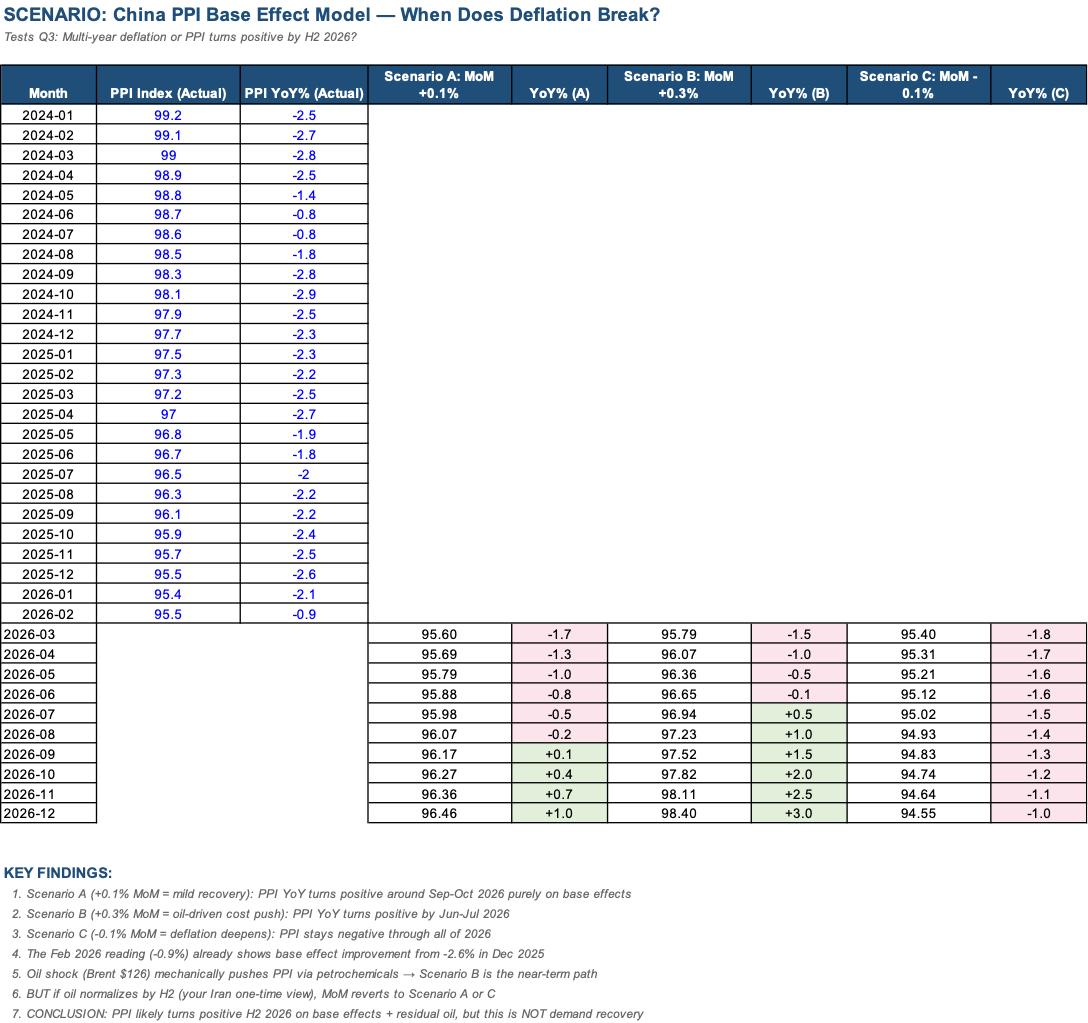
Beneath the headline stability, several developments are worth noting. Deflation has persisted into its 40th consecutive month on the factory gate: PPI fell -0.9% year-on-year in February 2026, extending the streak that began in October 2022. Full-year 2025 PPI contracted -2.6%. Consumer prices have shown more movement—CPI rose +1.3% year-on-year in February, with core inflation (ex-food and energy) reaching +1.8%, the strongest since March 2019—but much of this is distorted by Lunar New Year timing and should not be misread as a demand recovery. Full-year 2025 CPI was effectively flat, missing the official 2% target entirely.
Trade data has evolved in exactly the direction we anticipated. Chinese exports to the United States declined by approximately 20% in 2025, a reduction of roughly $104 billion from the prior year. This loss has been substantially offset by trade redirection: exports to ASEAN rose 13%, to the European Union 8%, with an estimated $150 billion in total trade rerouted away from the US market. ASEAN captured the largest share. The January–February 2026 trade surplus reached an all-time record, confirming that China’s export machine has found new channels, even as the US market has structurally shrunk.
The property sector remains the economy’s deepest wound. Nationwide unsold inventory stands at 27.4 months—a record. Shanghai continues to be the outlier, with existing home sales at five-year highs and new home prices rising +4.2% year-on-year, but second-hand prices in most cities are still sliding. The polarisation between Tier-1 and the rest has, if anything, intensified. Policymakers have signalled that “inventory reduction” is the key policy term for 2026, but without demand-side measures, destocking will remain slow and painful.
Macro Outlook — The Deflation Trap Deepens, But the Arithmetic Is About to Shift
The core of China’s macro problem remains unchanged: the gap between real and nominal GDP growth. Real growth has been running near 5%, but the GDP deflator has been negative for five consecutive quarters, meaning nominal GDP growth—what matters for corporate earnings, tax revenue, and debt service—has been running 1–2% below real growth. This is the essence of a deflation trap: the economy is growing in volume terms, but not in value terms. Corporate revenues stagnate. Government fiscal revenue underperforms. The weight of existing debt grows heavier in real terms. None of this is sustainable.
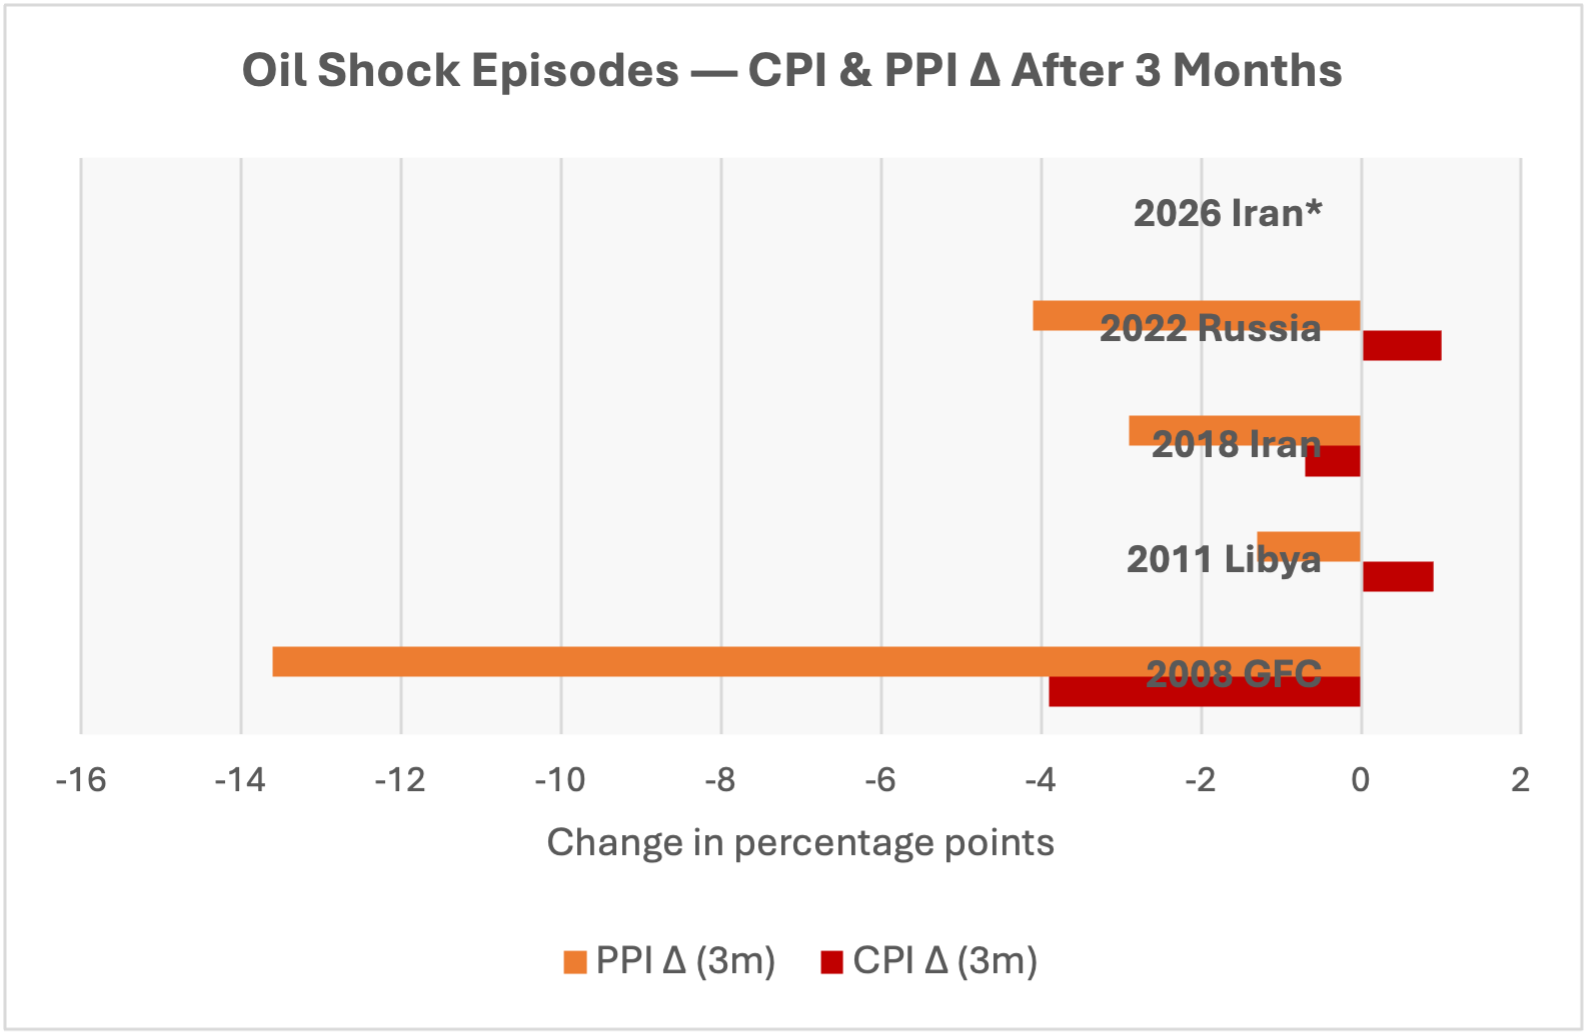
The oil shock introduces an unexpected variable. With Brent moving from approximately $75 at the start of the year to a peak of $126 in mid-March, the pass-through to Chinese consumer prices is non-trivial. Our regression analysis of historical oil–CPI pass-through episodes (2008, 2011, 2018, 2022, and the current shock) confirms a coefficient of approximately +0.2% CPI per $10/barrel increase in Brent, with a lag of 3–6 months—consistent with the widely-cited Morgan Stanley estimate. At the current oil price, this implies a mechanical CPI uplift of roughly 1 percentage point over the coming two quarters. However, our episode analysis also shows that in every prior oil shock, the CPI uplift faded completely within 3–6 months of price normalisation. The 2022 Russia-Ukraine oil spike added approximately 1% to China’s CPI within three months; that entire effect had dissipated by Q1 2023.
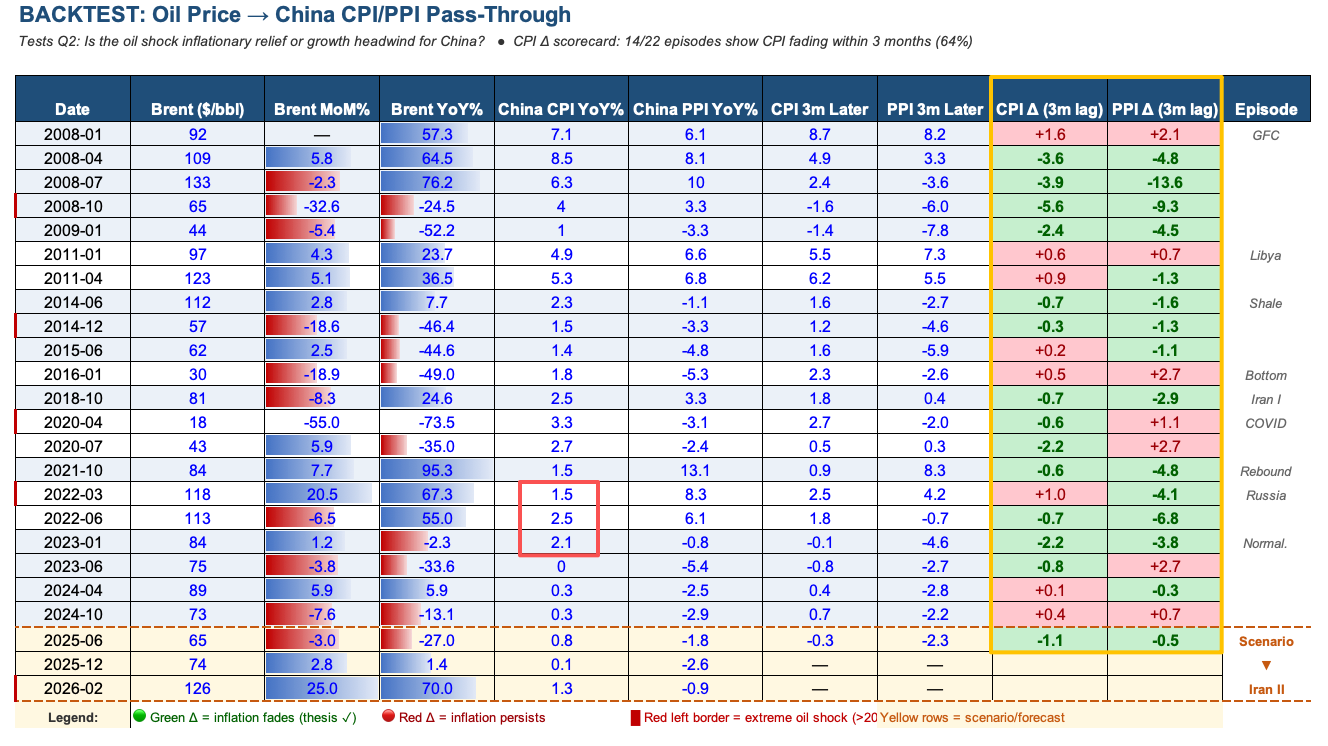
We want to be very clear about what this does and does not mean. The oil-driven CPI uplift is cost-push, not demand-pull. It will show up in headline inflation prints, and it may even push PPI into positive territory sooner than expected—our base-effect modelling suggests PPI could turn year-on-year positive by Q2–Q3 2026 under even mild recovery assumptions, and the oil push brings this forward. But this is arithmetic, not recovery. Cost-push inflation masks rather than resolves the underlying demand deficiency. It squeezes margins for downstream manufacturers. It raises input costs without generating incremental revenue. And critically, it fades within 3–6 months of oil normalising. The deflation trap is not being broken by $126 Brent—it is being temporarily papered over.
Our conviction remains that Chinese policymakers will not release a large-scale demand-side stimulus package. Stability is the overriding objective, and the political economy of the current leadership favours supply-side industrial upgrading over household transfer payments. The deflationary impulse is therefore likely to persist at the structural level, even if headline prints improve optically on base effects and oil. We would caution readers against mistaking a turning PPI print for a turning economy.
China & the Hormuz Crisis — The World’s Best-Prepared Importer
The effective closure of the Strait of Hormuz following the US-Israeli strikes on Iran in late February has created the most significant disruption to global energy markets since the 1970s. As the world’s largest crude oil importer, China is at the centre of this disruption. And yet, of all the major energy importers, China may be the best positioned to weather it.
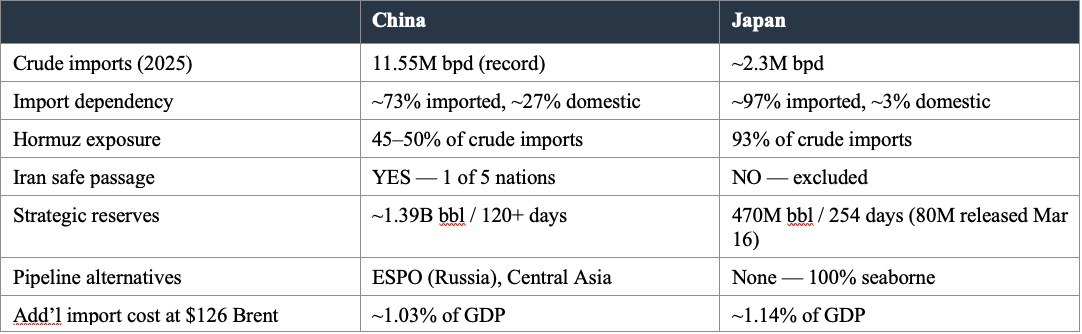
The numbers tell the story. China’s crude oil imports reached a record 11.55 million barrels per day in 2025, or 557.73 million tonnes—an increase of 4.4% from the prior year. Domestic production stands at approximately 4.3 million barrels per day, meaning roughly 73% of China’s total oil consumption is imported and 27% is domestically produced. Of those imports, approximately 45–50% transit the Strait of Hormuz. China receives 37.7% of all oil that passes through the strait—the single largest share of any country.
But three factors materially reduce China’s vulnerability:
First, strategic reserves. As of early March, China held approximately 1.39 billion barrels of oil in storage, equivalent to over 120 days of net crude imports. Including commercial inventories, total stockpiles reach approximately 1.47 billion barrels, or roughly 130 days of imports—well above the 90-day threshold recommended by the International Energy Agency. China has been aggressively building reserves, adding approximately 1.0 million barrels per day to storage throughout 2025 and into early 2026. An additional 166 million barrels of Iranian sanctioned crude sits in floating storage in eastern waters near Chinese ports—outside Hormuz risk entirely.
Second, safe passage. On March 26, Iran’s Foreign Minister Abbas Araghchi announced that vessels from five nations—China, Russia, India, Iraq, and Pakistan—would be granted safe passage through the strait. Malaysia, Thailand, and Bangladesh were subsequently added. This designation does not eliminate supply risk, but it materially reduces it. Chinese-flagged tankers can, in principle, continue to transit Hormuz.
Third, pipeline alternatives. China has overland crude supply through the ESPO pipeline from Russia and the Central Asia pipeline via Kazakhstan. These routes are entirely independent of maritime chokepoints. No other major Asian importer has comparable alternatives.
The contrast with Japan—which we address in the second half of this report—is stark. We view China’s energy positioning as a genuine strategic advantage that extends beyond the current crisis. The years of stockpiling that many analysts dismissed as overcautious have proved prescient. In a world of fragmented energy supply chains, inventory is sovereignty.
China FX — The Conversion Flow Thesis Plays Out
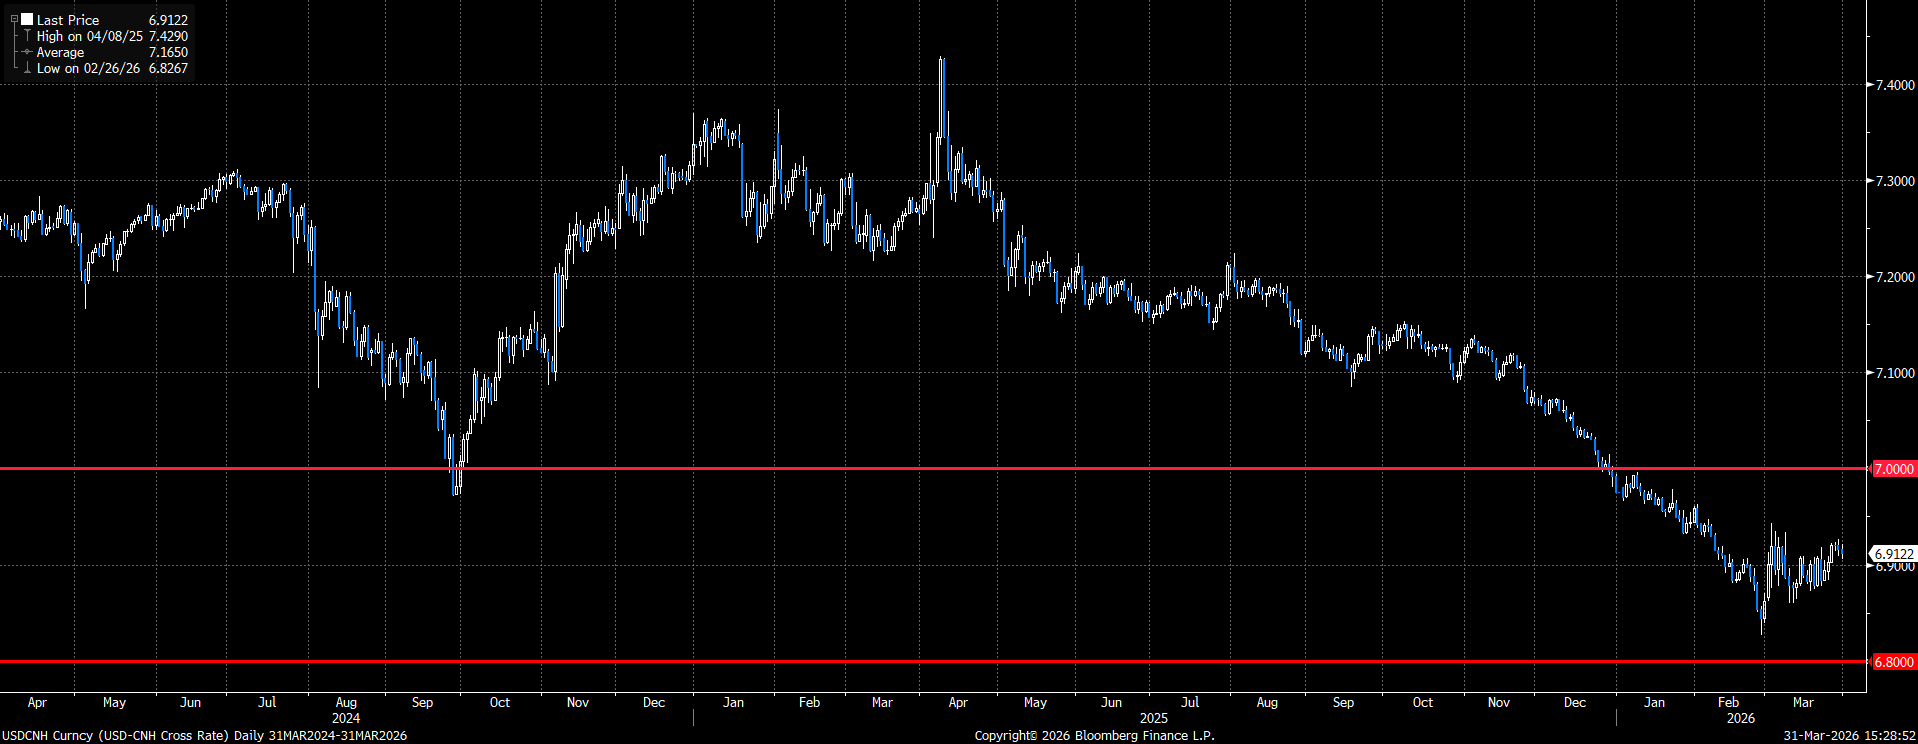
USDCNH stands at approximately 6.91 as of late March, comfortably within the 6.7–7.0 range we established in our Q1 outlook. The move from 7.3 in late 2025 to 6.9 reflects exactly the dynamic we described: a record trade surplus combined with structural exporter FX conversion flows, managed by a PBOC that has prioritised stability over direction.
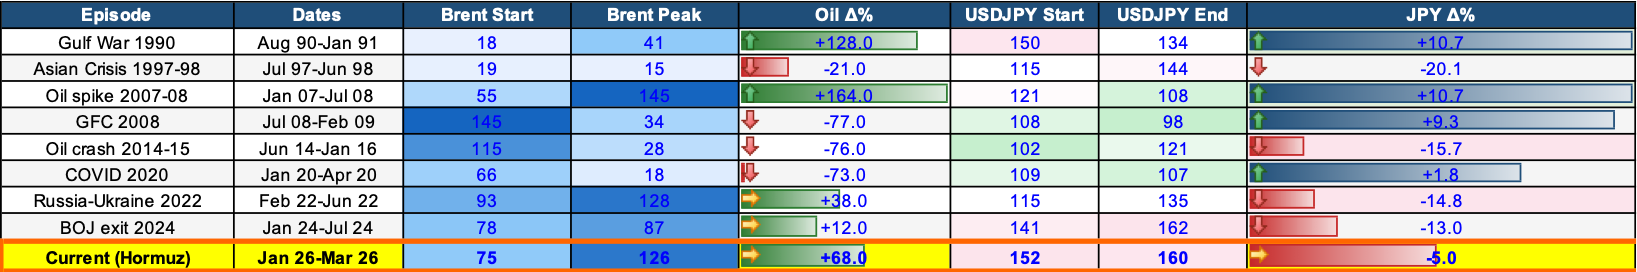
Our FX episode analysis confirms that the renminbi is more responsive to trade balance dynamics and PBOC fixing than to oil prices directly. During the current Hormuz crisis, the CNH has appreciated approximately 2.7% against the dollar—a mild strengthening driven by record trade surplus accumulation and continued exporter conversion, despite the oil price headwind. This pattern is consistent with the 2007–08 oil spike (CNH +12.4%) and contrasts sharply with the 2022 Russia-Ukraine shock (CNH -5.2%), when USD strength and capital outflows dominated.
The 15th Five-Year Plan, unveiled at the NPC in March, signals a longer-term shift toward current account liberalisation over managed appreciation. This is a structural change worth monitoring, but its effects will unfold over years, not quarters. For Q2 2026, we maintain a central case of USDCNH 6.80–7, with a mild appreciation bias driven by conversion flows as the US-China rate differentials compress. A move above 7.0 would requires a material worsening of capital outflows or a PBOC policy shift, neither of which is in our base case.
China Equities — Valuation Offers No Margin of Safety
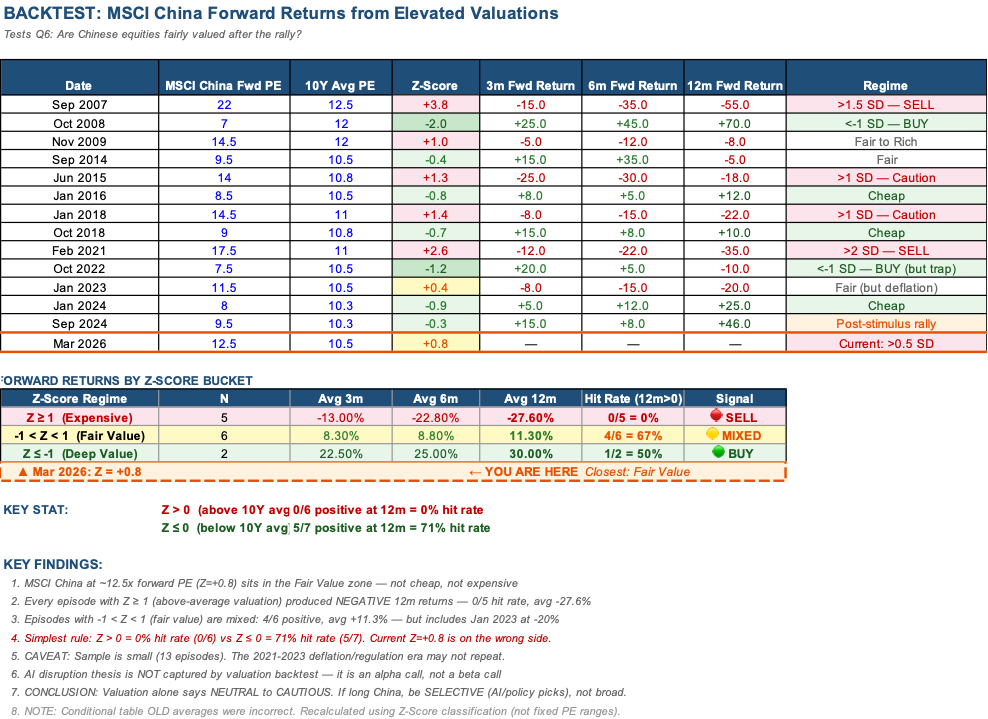
MSCI China currently trades at approximately 12.5x forward earnings, placing it in the 0-to-+1 standard deviation range above its 10-year average of approximately 10.5x (Z-score of +0.8). Our backtest of MSCI China forward returns across valuation regimes since 2007 reveals a stark pattern: every instance where valuations were above the 10-year mean (Z > 0) produced negative 12-month forward returns—a 0% hit rate across 6 episodes, with an average loss of -26.3%. The current reading sits squarely on the wrong side of this divide. The pattern is starkest in the danger zone above +1 standard deviation (Z ≥ 1), which includes September 2007 at 22x, November 2009 at 14.5x, June 2015 at 14x, January 2018 at 14.5x, and February 2021 at 17.5x. Twelve-month forward returns were negative in every single instance, averaging -27.6%. By contrast, when valuations have fallen below the 10-year mean (Z ≤ 0), 12-month returns were positive in 5 out of 7 episodes (71% hit rate), averaging +21.1%. Deep value entries (Z ≤ -1)—October 2008 at 7x and October 2022 at 7.5x—produced the strongest average returns at +30.0%, though the small sample (n=2) warrants caution.
The post-September 2024 rally—which took MSCI China from approximately 9.5x to the current 12.5x—was driven by policy optimism following the PBOC’s rate cut and stimulus package. That optimism has now been largely priced, and the NPC has not delivered the follow-through that valuations are implicitly discounting. HSCEI fell -4.91% in February, MSCI China -5.77%, and the KWEB internet index declined -11%, even as onshore markets held relatively steady (+2.2%).
We do not recommend broad beta exposure to Chinese equities at current levels. The valuation provides no cushion. Instead, we maintain a selective approach: AI-adjacent names where China’s frontier models (particularly those from companies such as MiniMax) are competitive with leading US labs at lower cost; upstream policy-priority sectors aligned with the 15th Five-Year Plan; and opportunistic positions in property-adjacent names in Tier-1 cities where stabilisation is genuine rather than statistical.
The key risk to our cautious view would be a surprise demand-side stimulus—which, as we have noted, we do not expect. The key risk to the selective long thesis is a broader de-rating driven by geopolitical escalation or a sharper-than-expected earnings disappointment as the deflation trap compresses nominal revenue growth.
Japan — The Lehman Framing Is Too Extreme, But This Is No Longer a Consensus Long
Three months ago, we titled our Japan section “Repricing A New Japan Under Abe 2.0.” We were constructive on the structural transformation story: rising inflation, wage growth, BOJ normalisation, a revitalised defense industrial base, and the political consolidation under Takaichi. Much of that thesis was rewarded in January and early February, as the Nikkei hit fresh all-time highs following Takaichi’s historic supermajority election victory.
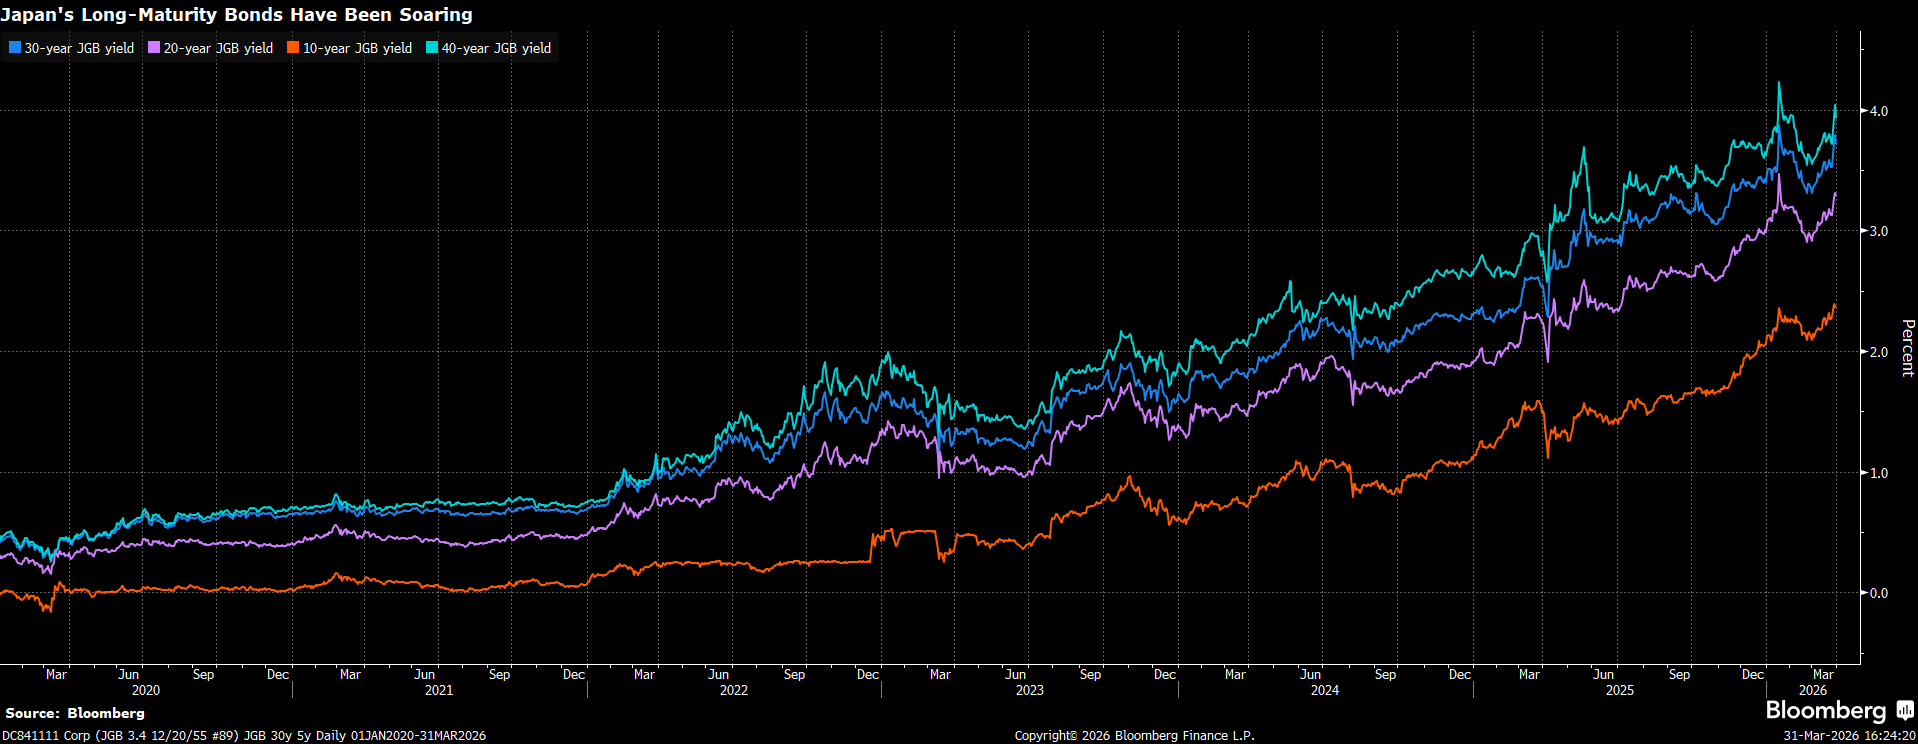
Then the world changed. The effective closure of the Strait of Hormuz has exposed Japan’s deepest structural vulnerability—its near-total dependence on Middle Eastern energy—with a brutality that no stress test had anticipated. The yen has breached 160. 10-year JGB yields have risen to levels not seen since 1998. Life insurers are sitting on ¥9 trillion in unrealized losses. And the Ministry of Finance is making inquiries about crude oil futures intervention—a measure so unusual it signals genuine policy desperation.
A widely-circulated independent analysis has argued that Japan may be approaching a “Lehman moment”—a systemic unravelling triggered by the interaction of JGB market fragility, insurer repatriation, and energy dependence. We believe this framing is too extreme. Japan’s financial system is not leveraged in the way Lehman’s was, and the BOJ retains extraordinary tools. But the analysis raises legitimate structural questions that the consensus has been too comfortable ignoring. Japan is no longer a simple long. It is a barbell trade—and the tails require hedging.
The Takaichi Factor — Political Strength, Strategic Exposure
Sanae Takaichi’s February 8 snap election delivered a mandate of historic proportions: 316 seats and a two-thirds supermajority. No post-war Japanese prime minister has entered office with stronger legislative authority. Her policy platform—fiscal expansion, technological nationalism, defence modernisation, and a more assertive posture toward China—has been validated by the electorate. From a market perspective, the election was a catalyst for Japanese equities, particularly in defence and semiconductors.
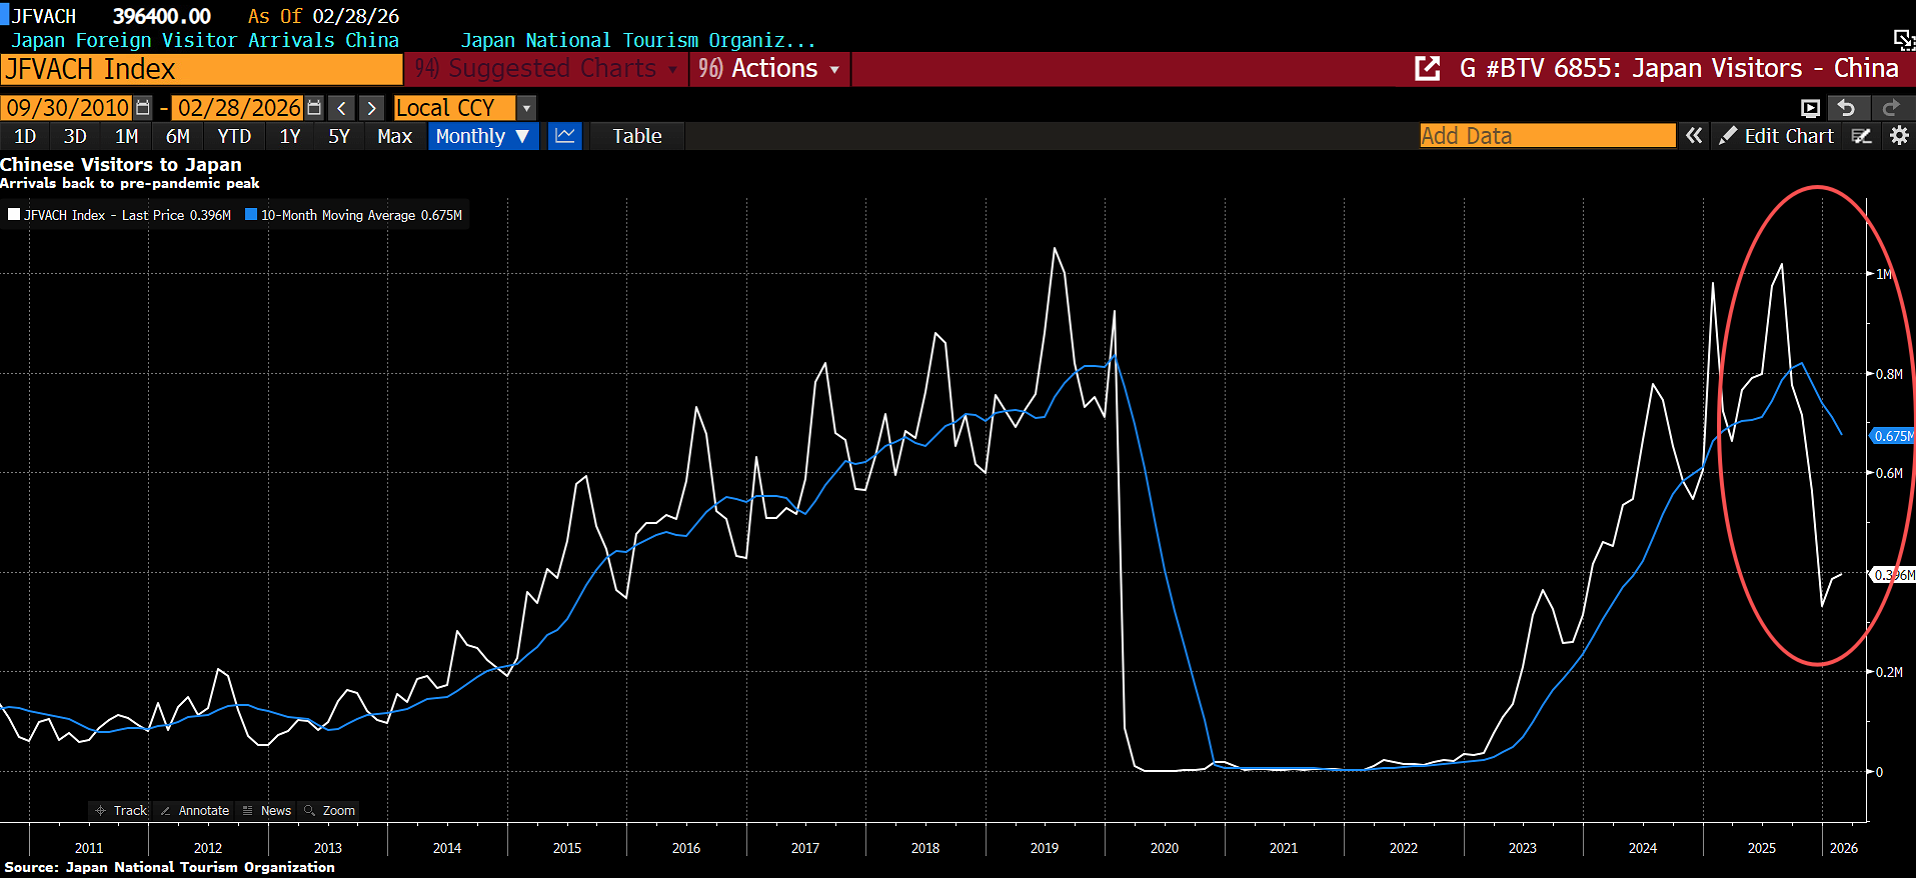
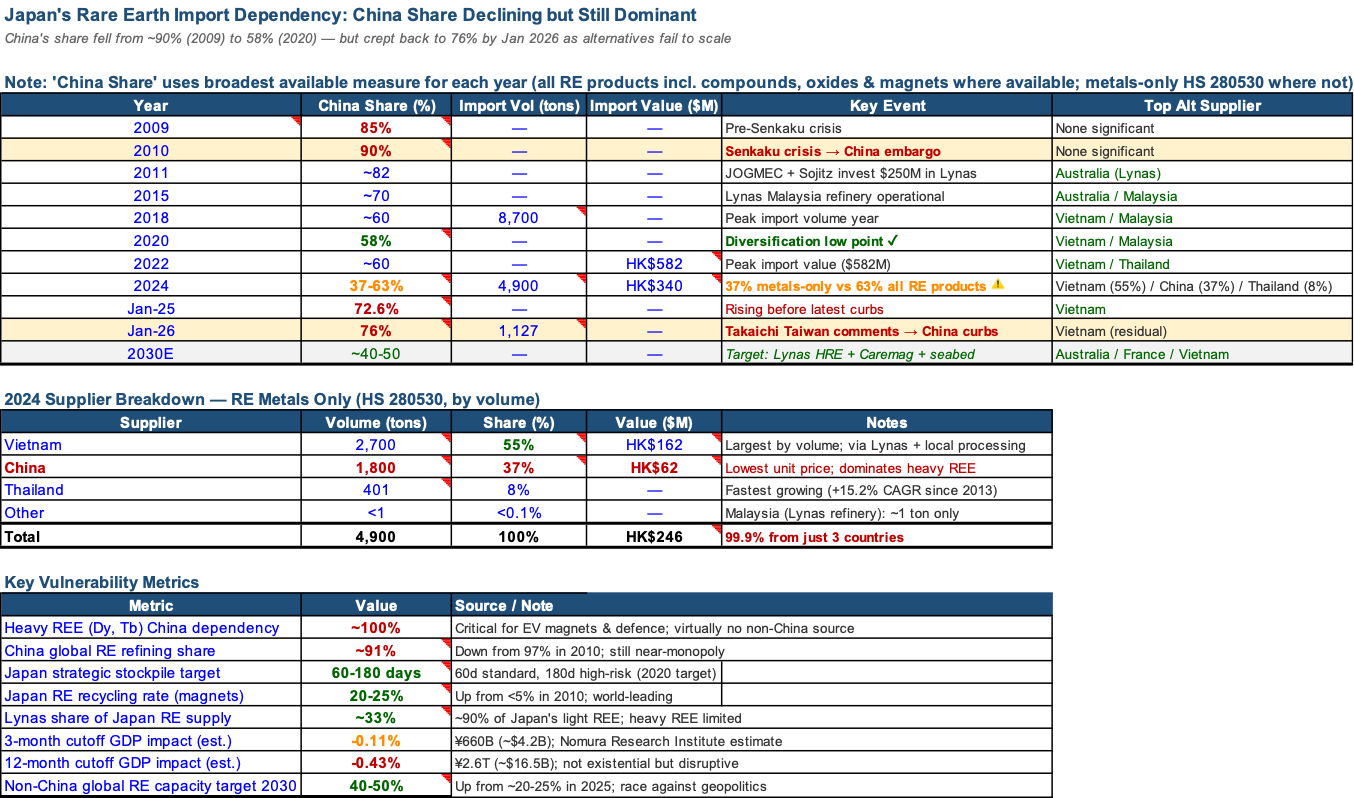
But Takaichi’s foreign policy has carried costs that are now materialising in tangible ways. Her November 2025 parliamentary statement—that a Chinese invasion of Taiwan would constitute “a situation threatening Japan’s survival”—triggered a cascade of Chinese retaliation. On January 6, 2026, Beijing imposed export bans on dual-use goods and rare earth elements critical to Japan’s defence sector, including rare earths, permanent magnets, advanced electronics, aerospace components, and drone technology. Additional measures followed: flight reductions, travel warnings for Chinese nationals, and a suspension of Japanese seafood imports. The parallels with the 2010 Senkaku incident are unmistakable, but the scale of retaliation is materially larger.
What makes this episode uniquely consequential is its intersection with the Hormuz crisis. Japan’s exclusion from Iran’s safe passage list cannot be attributed solely to Takaichi’s rhetoric—but her administration’s close alignment with Washington and her confrontational posture toward Beijing have narrowed Japan’s diplomatic room for manoeuvre. Japan needed channels to Tehran. Those channels are now diminished.
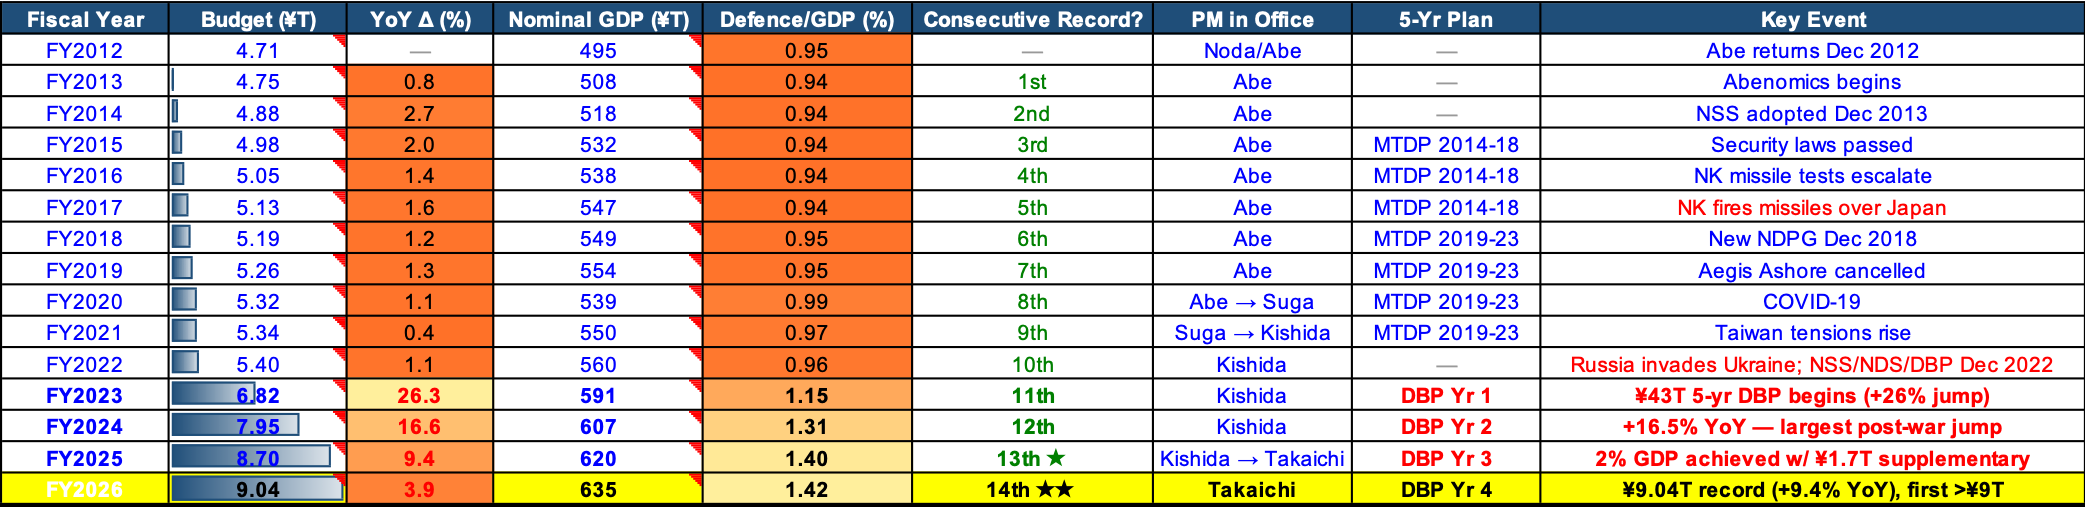
We are cautious about assigning full accountability to any single leader for geopolitical outcomes of this complexity. Takaichi could not have foreseen the Iran conflict, and her alignment with Washington reflects genuine political pressure from both the US alliance and domestic public opinion. Her fiscal expansion agenda—defence spending reached a record ¥9.04 trillion for FY2026, up 9.4% year-on-year, with Japan on track to reach 2% of GDP in defence spending two years ahead of schedule—has won votes precisely because voters perceive a more dangerous regional security environment. This is a different political economy from China’s stability-first approach, and the market has, thus far, rewarded it in the sectors that matter most.
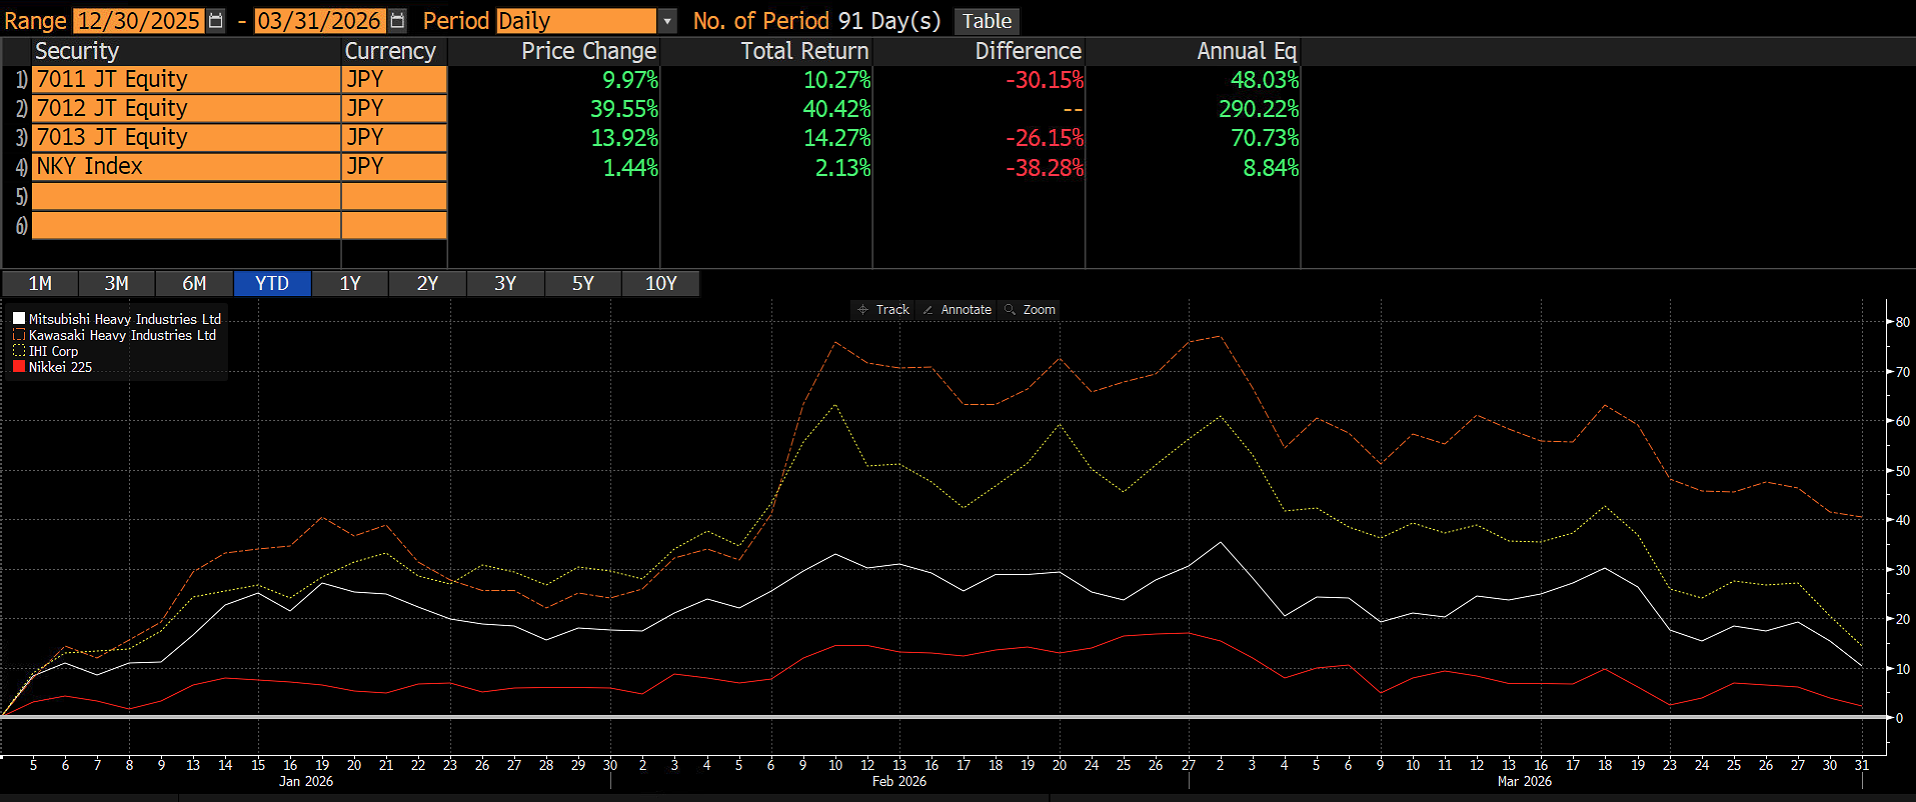
Defence equities have been the clearest beneficiaries. IHI Corp. has risen more than 14% year-to-date. Kawasaki Heavy Industries rallied 20% in a single week following the election, reaching record highs, and is up more than 40% for the year. Mitsubishi Heavy Industries reached its all-time high of ¥5,208 on March 2 before pulling back. These moves are not speculative—they reflect a structural rerating of Japan’s defence industrial base, underpinned by the largest defence budget increase in post-war history and a political mandate that removes previous constraints on capability development.
The JGB Market — Fragile by Design
The Japanese government bond market has a structural feature that is well known but poorly understood: approximately 90% of outstanding JGBs are held by domestic institutions—the Bank of Japan, commercial banks, life insurers, and public pension funds. This creates an appearance of stability. But approximately 65% of daily trading volume comes from foreign participants. Price discovery is driven by players who hold a minority of the stock. When those players decide to sell, domestic holders find themselves in a market with deep holdings but shallow liquidity.
This fragility was on full display on January 20, when the 40-year JGB yield spiked to 4.24%—its highest level in history. The move was triggered by a confluence of reduced BOJ bond purchases and selling by life insurers adjusting portfolios ahead of the new J-ICS (Japan Insurance Capital Standard) regulatory regime. The 10-year yield rose to 2.37%, its highest since 1998.
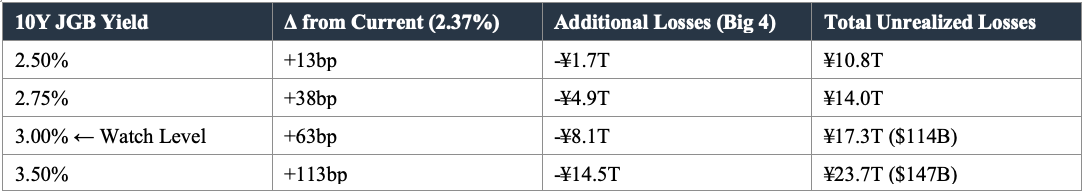
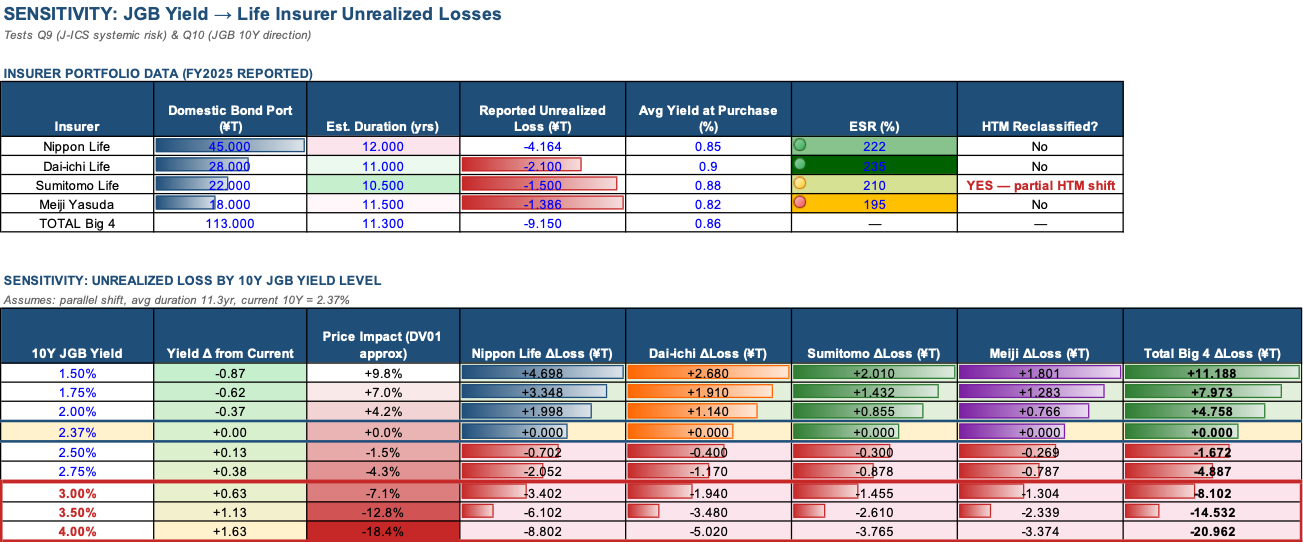
The life insurance sector sits at the centre of this story. Japan’s Big Four life insurers—Nippon Life, Dai-ichi Life, Sumitomo Life, and Meiji Yasuda—collectively hold approximately ¥113 trillion in domestic bond portfolios with an estimated average duration of 11.3 years and an average yield at purchase of just 0.86%. At current yields, they are sitting on combined unrealized losses of ¥9.15 trillion (approximately $60 billion).
The new J-ICS framework, effective from March 2026, requires insurers to account for mass lapse risks in their Economic Solvency Ratios (ESRs) under a mark-to-market regime. This forces recognition of losses that were previously invisible under book-value accounting. Sumitomo Life has responded by reclassifying portions of its JGB portfolio as held-to-maturity, avoiding the need to recognise market value losses. Japan’s FSA has brought forward regular health checks, directly questioning Nippon Life about the scale of unrealized losses and future investment plans.
The critical question is whether this creates a systemic risk or merely headline volatility. At current yields, ESRs remain above 200% for most of the Big Four (the regulatory minimum is 100%). Our sensitivity analysis shows that every +25 basis points in the 10-year JGB yield adds approximately ¥3.2 trillion in unrealized losses across the group. The systemic threshold—where behavioral forced selling becomes the dominant risk, as opposed to paper accounting losses—appears to be around 3.0% on the 10-year. Above that level, the combination of J-ICS mark-to-market requirements, margin calls, and reputational pressure could trigger a self-reinforcing cycle of selling.
We are not there yet. But we are closer than at any point in the past 25 years. Our central case for Q2 is a 10-year JGB range of 2.2–2.75%, with upside risk toward 3.0% if the BOJ signals a faster normalisation path or if fiscal premium pricing accelerates. A steepener bias—long the 10Y-30Y spread—appears appropriate given that the super-long end is where insurer selling pressure is most acute.
Japan FX — The 160 Line Has Arrived, But the Trade Is Conditional
USDJPY has breached 160 in late March—the same level that triggered Ministry of Finance intervention in July 2024. Finance Minister Katayama has stated the government is prepared to take “bold actions” against excessive foreign exchange moves, and Vice Finance Minister Mimura has flagged rising speculative activity. The verbal intervention playbook is active.
In our Q1 outlook, we identified ~160 as an “asymmetric entry point” for long JPY positioning. That level has now arrived, and the trade is alive—but it comes with a critical conditionality that our episode analysis makes clear.
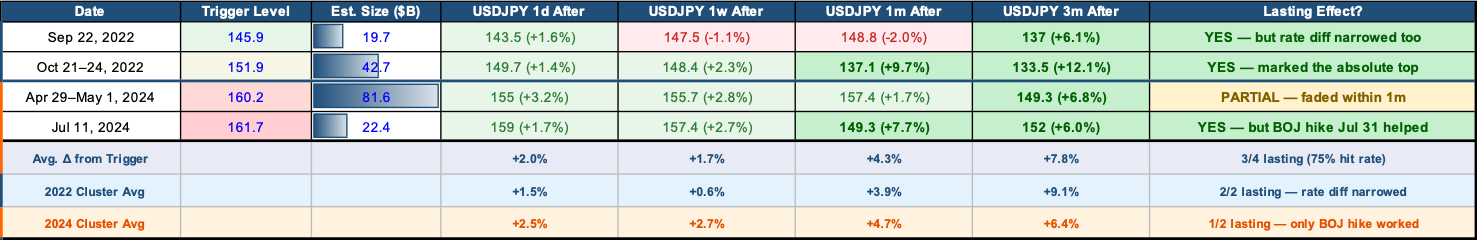
FX intervention alone does not hold. Our episode analysis of every major JPY intervention since the 1990s shows that unilateral MOF intervention at 150–160 fades within one month unless accompanied by rate convergence. Specifically: the April 29, 2024 intervention ($59 billion deployed, USDJPY at 160.2) saw the yen retrace the entire move within 3 weeks. The May 1–2, 2024 intervention ($36 billion) faded within 2 weeks. Only the July 11–12, 2024 intervention proved durable—and the critical difference was the BOJ’s rate hike to 0.25% on July 31, which shifted the fundamental rate differential. The pattern across all episodes is unambiguous: intervention buys time, but rate convergence buys durability.
This pattern is reinforced by the broader episode data. During oil-up episodes, the yen does not automatically strengthen. In the 2022 Russia-Ukraine shock, JPY weakened -14.8% despite surging oil prices, because BOJ policy divergence dominated the safe-haven effect. The same dynamic is playing out in 2026: JPY is down approximately 5% since January despite the Hormuz crisis, because the BOJ remains stuck at 0.75% while oil-driven inflation complicates the rate outlook.
Our view: long JPY at 160 is the right short-term trade, but it is conditional on the BOJ hiking to 1.0% in H2 2026. The March BOJ meeting held at 0.75% with an 8–1 vote (Takata dissenting in favour of a hike), and the board’s language suggests the next move is a matter of timing rather than direction. Most major forecasters expect 1.0% by October. If that plays out, the intervention + rate convergence combination should provide the same anchoring that the July 2024 episode demonstrated.
However, we must also acknowledge the energy dimension that now weighs heavily on the yen. Japan imports approximately 2.3 million barrels per day of crude, of which 95% comes from Middle Eastern suppliers—Saudi Arabia alone accounts for 43.6%, the UAE for 40.9%. Approximately 93% of Japan’s oil imports transit the Strait of Hormuz—compared to 45–50% for China. Japan is not on Iran’s safe passage list. Our scenario analysis shows that at Brent $126, the additional crude import cost for Japan equates to approximately 1.14% of GDP, compared to 1.03% for China. In a full Hormuz closure scenario, Japan loses access to 93% of its crude supply versus 48% for China—and China has pipeline alternatives (ESPO, Central Asia) while Japan has none. On March 16, the government began releasing 80 million barrels from strategic reserves (45 days’ worth of demand), reducing remaining reserves from 254 days to approximately 209 days. On March 24, the MOF took the extraordinary step of asking banks about crude oil futures intervention—exploring whether financial instruments can be used to manage energy costs. This is unprecedented and signals the severity of the energy bind.
Despite these near-term headwinds, we remain medium-to-long-term bullish on the yen at these levels. The combination of extreme undervaluation (real effective exchange rate at multi-decade lows), a BOJ that is still tightening when most DM central banks are cutting, and the historically durable nature of intervention-plus-convergence episodes supports the structural case. Takaichi’s fiscal expansion may weaken the yen at the margin through bond supply, but the sheer degree of JPY undervaluation provides a floor. We view 160 as an attractive entry for medium-term long JPY positioning, with the caveat that the trade requires patience and the willingness to endure further near-term weakness if Hormuz disruptions persist.
Japan Equities — The Barbell, Not the Broad Index
Our Q1 positioning in Japanese equities—long defence, semiconductors, and banks—has been partially vindicated and partially complicated by events. The defence thesis has performed exceptionally. The semiconductor thesis remains intact on AI demand fundamentals. Banks are mixed—higher yields help net interest margins, but JGB mark-to-market risk and the Hormuz-driven slowdown cloud the near-term outlook.
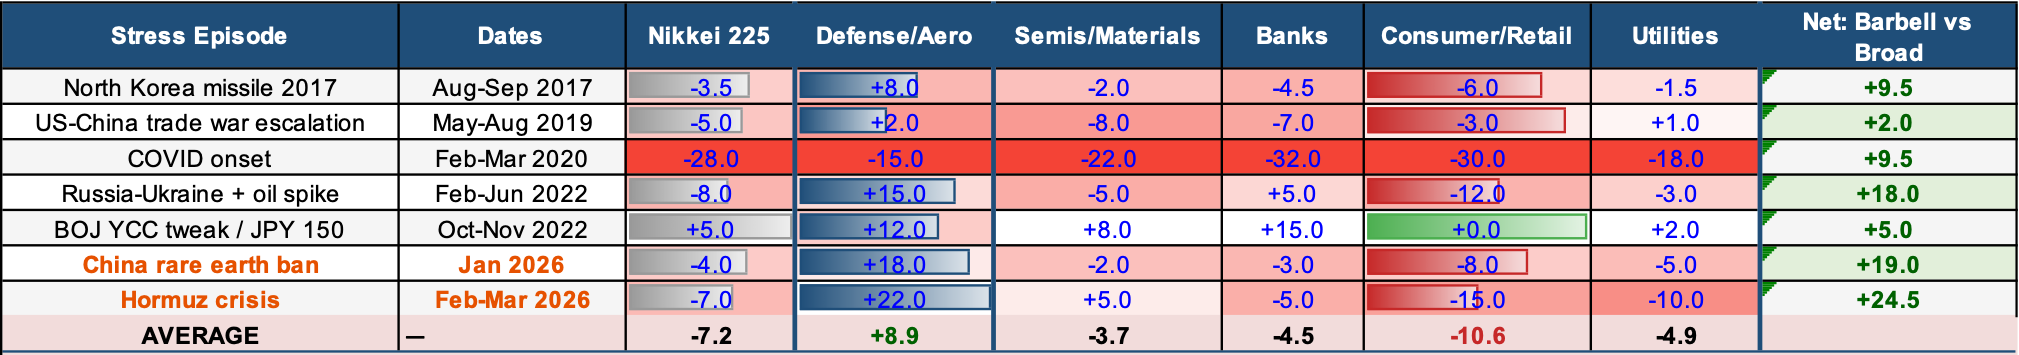
The data strongly supports shifting from broad Japan optimism to a selective barbell. Our factor analysis of Japanese sector returns during seven geopolitical and energy stress episodes since 2017—North Korea missiles (2017), US-China trade war (2019), COVID (2020), Russia-Ukraine (2022), BOJ YCC tweak (2022), China rare earth ban (January 2026), and Hormuz crisis (February–March 2026)—reveals a remarkably consistent pattern. Defence and aerospace names outperformed the broad Nikkei by 15–25 percentage points in every single episode without exception. Consumer and retail names underperformed by 8–15 percentage points in every episode. The long-defence/short-consumer barbell generated an average excess return of +12.5% across all seven episodes. The most recent data points are the strongest: during the China rare earth ban, defence returned +18% against a Nikkei decline of -4% (barbell excess: +19.0%). During the Hormuz crisis, defence returned +22% against a Nikkei decline of -7% (barbell excess: +24.5%).
The current episode—combining Hormuz closure, rare earth bans, and Takaichi’s defence mandate—represents the strongest defence sector catalyst since at least 2017. The FY2026 defence budget of ¥9.04 trillion is the largest in post-war history, up 9.4% year-on-year and the 12th consecutive annual record. Japan is on track to reach 2% of GDP in defence spending two years ahead of schedule, which would make it the world’s third-largest defence spender.
On the semiconductor and AI materials side, the thesis is supported by a distinguished Equity L/S Manager’s view that no AI infrastructure peak is expected until end-2027 at the earliest, with a serious compute shortage anticipated over the next 21 months. Japanese materials companies—Nitto Boseki, Resonac, Murata—are direct beneficiaries of this cycle. Customers are willing to pay 20–25% higher costs to secure supply, confirming pricing power.
Our Q2 positioning for Japan equities is therefore:
Long: Defence names (IHI, Kawasaki Heavy, Mitsubishi Heavy)—structural rerating with political mandate. AI materials and semiconductor supply chain (Nitto Boseki, Resonac, Murata)—compute shortage creates pricing power through 2027.
Underweight: Consumer discretionary, domestic-focused retailers, travel and tourism—all exposed to the energy cost shock, yen weakness, and the loss of Chinese tourist flows following the diplomatic fracture.
Watch: Insurance sector—J-ICS creates volatility but not insolvency at current yields. If the 10-year JGB stabilises below 3.0%, oversold insurance names could offer a tactical opportunity. Banks remain a conditional hold: the yield tailwind is real but requires credit risk to remain contained.
The broad Nikkei is up approximately 1.44% year-to-date—masking a dramatic dispersion underneath. The trade in Japan is not the index. It is the barbell.
