2025 Q4 Global Economic Outlook (I) - US

US Summary
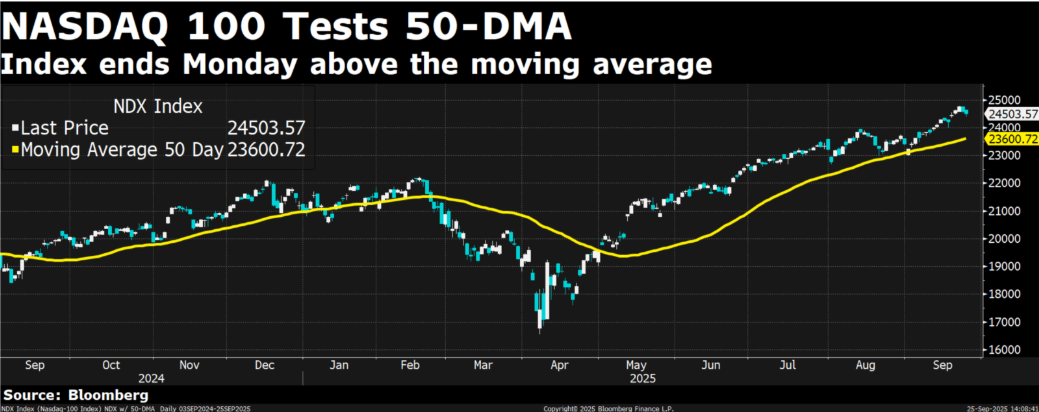
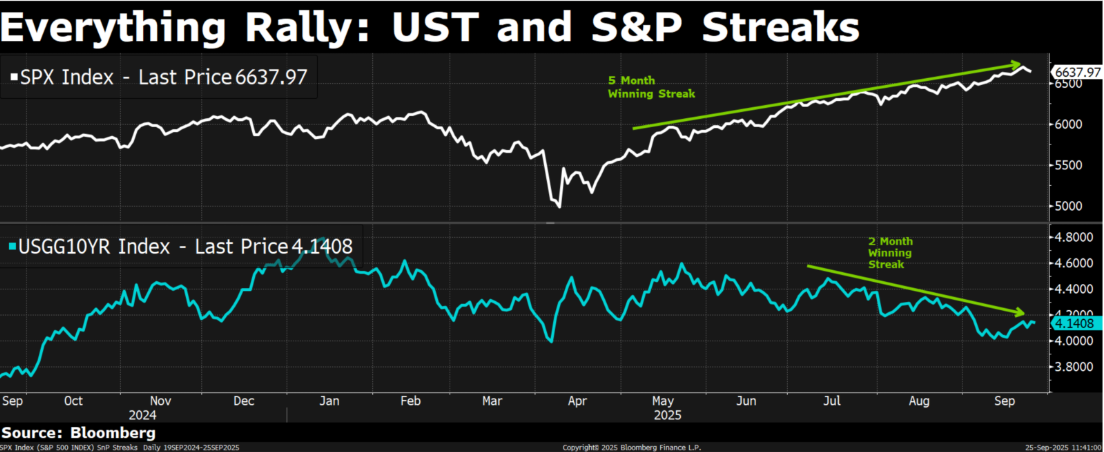
One headline that stood out to us in GS’s weekend recap was the following: “The largest drawdown the S&P has seen since the beginning of May has been -2.7% during a 4-day span. We’re also now at one of the longest streaks of having not witnessed a -2% selloff … It’s been >100 days.”
This puts into perspective just how unusual the current environment has become. We are arguably living through one of the most speculative periods in market history. Almost every major asset class now sits at or near all-time highs, which makes capital deployment increasingly tricky.
The question for Q4 is not simply whether prices look good on the surface — they clearly do — but whether the fundamentals truly justify these levels. Is everything as solid as current valuations suggest? Or, beneath the surface of the AI tide that has swept markets higher, are there risks worth probing more deeply? Welcome to this episode of Economic Outlook.
After Sep Cut
Compared with our previous view, we now expect one additional cut in 2025 (2 cuts in total this year). The inflection came after Powell’s unexpectedly swift pivot at Jackson Hole, which shifted the market narrative decisively. Since then, expectations for easing have accelerated — arguably more aggressively than fundamentals justify.
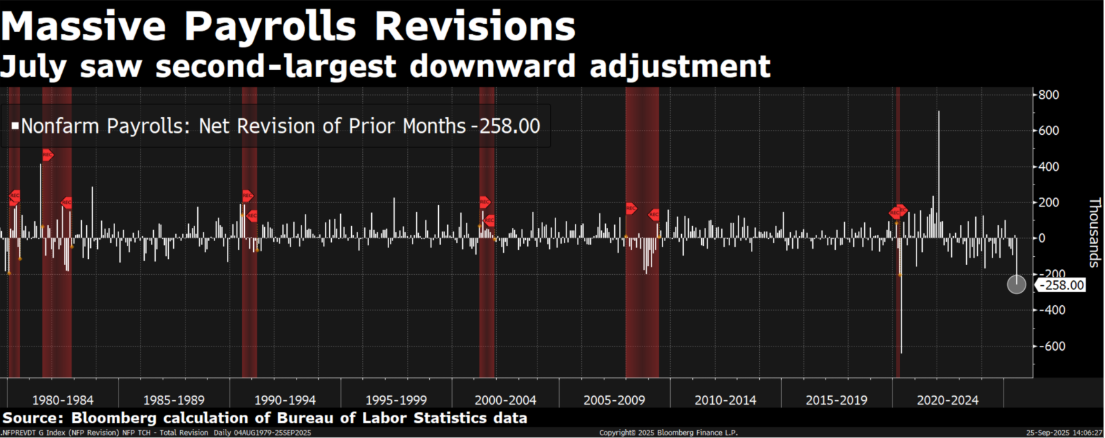
For me, what we did not see previously (the true turning point) was the July NFP revision, where nearly 200k jobs in the last month were revised away. It underscored a growing challenge: public data has become less reliable, largely due to falling response rates. Despite weaker data quality, markets continue to react strongly to data surprises. The lesson I learned here is not to anchor forecasts purely on noisy indicators, but instead to: Focus on consensus positioning — what the market is already pricing; Listen to Fed communication — speeches and statements offer a more stable guide than volatile prints; and Fade overreactions — when unreliable data drives abrupt moves, treat them as noise rather than signal.
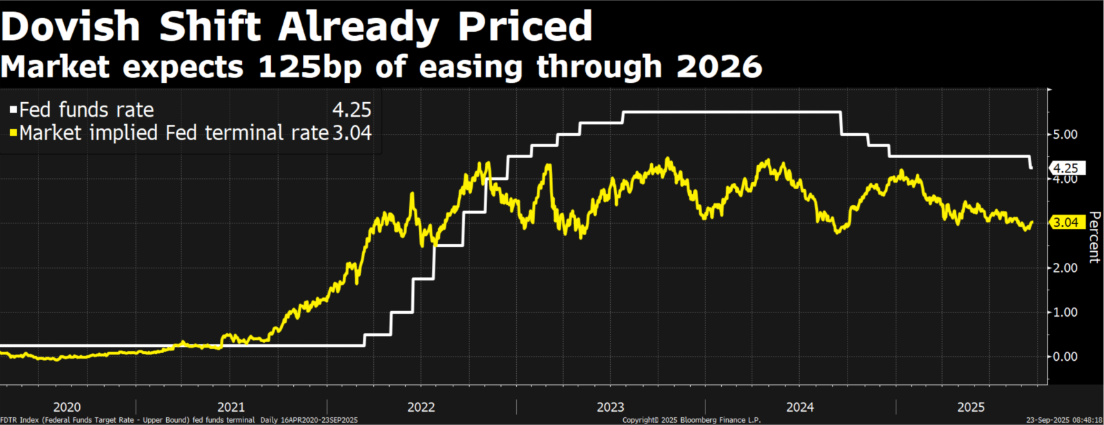
Against this backdrop, while the market has already priced in an additional 50 basis points of cuts by year-end, our view remains more conservative: one more cut. Powell himself framed the last move as a “risk management cut”, aimed at cushioning the labor market from further weakness, while still acknowledging that inflation risks could move up (just a matter of time but might take up to 1 year for the impact to spill over into consumers from producers). Even the most dovish members of the committee, Waller and Bowman, held the line at 25 basis points rather than 50, a reminder that the Fed has not fully surrendered its independence to the market narrative.
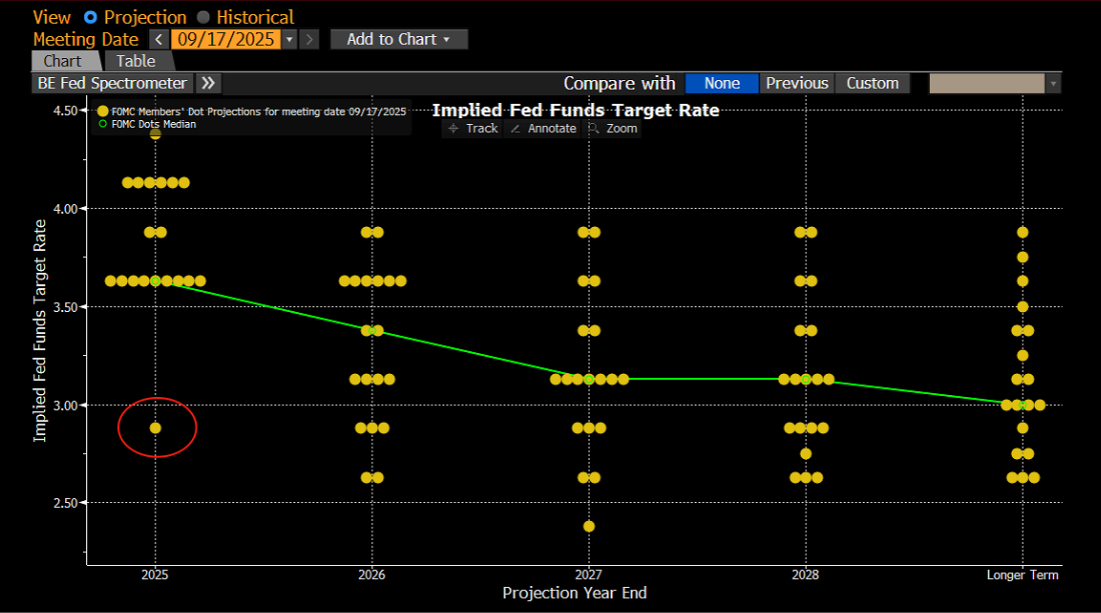
Much of the attention has been captured by the headline “Dot Plot,” which points to two more cuts this year. Yet looking beneath the surface tells a different story. Of the 19 voters, nine expect one cut or less, nine see two cuts, and the only extreme outlier is Miran, who was the previous Chairman of the Council of Economic Advisers under Trump, who just secured a seat on 16 September, who penciled in a staggering 125 basis points of easing in this FOMC. Without this outlier, the distribution sits squarely between one and two, leaving the true message far less dovish than the headline suggests.
In short, the market may be pressing aggressively for a dovish outcome, but the Fed itself remains more measured. Our role, then, is not to be swayed by every noisy print or dramatic revision, but to interpret the narrative with discipline, distinguish signal from noise, and position accordingly.
Big Picture
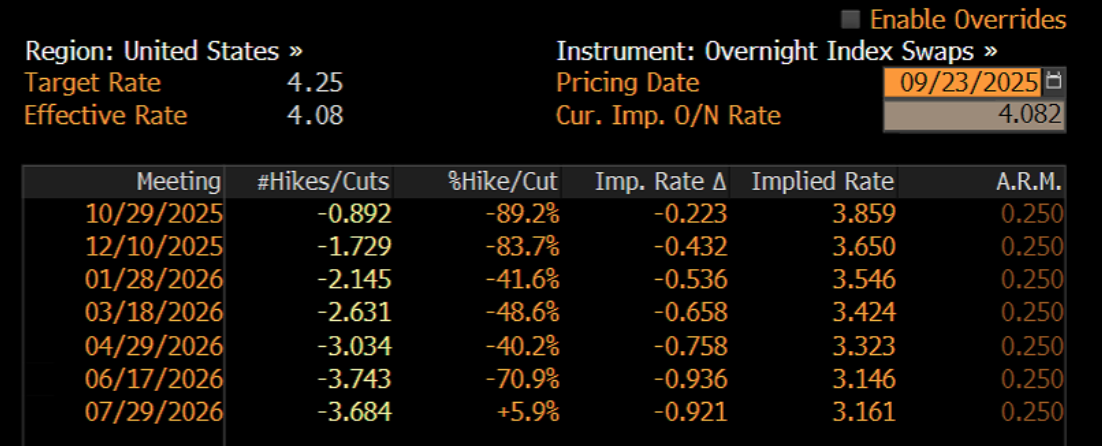
Our take from the latest OIS curve is that rates look a touch overvalued. As we noted earlier, the market is once again running ahead of the Fed—pricing a far more aggressive easing cycle than policymakers themselves have signaled. We’ve seen this movie several times in recent years, and the pattern feels familiar.
Before diving deeper into rate dynamics, it’s worth stepping back and framing the big picture. The key question is: Where are we now?
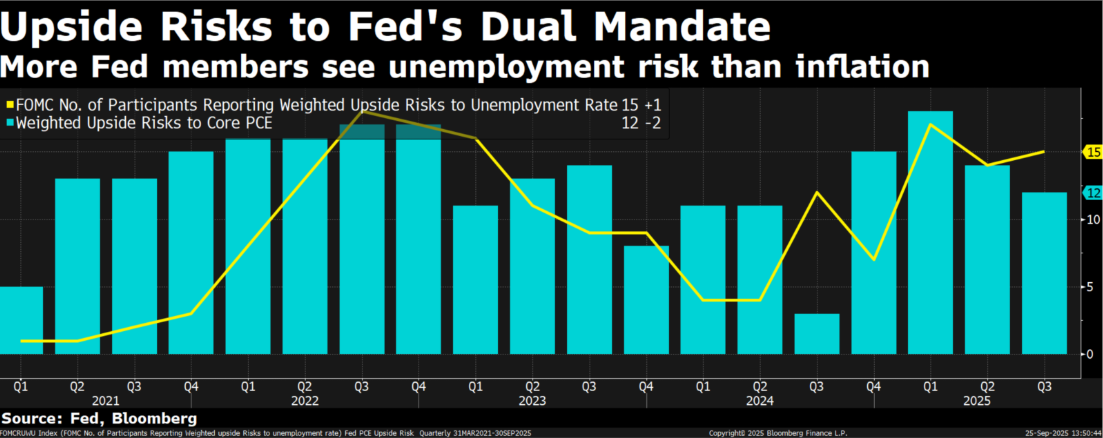
Since the August payrolls, cracks in the labor market have widened into a visible crevasse. Powell’s rhetoric has gradually shifted—less fixation on inflation, more concern about labor market deterioration. Some argue that strong equity markets and AI-driven capex will keep the Fed cautious. But this misses the point: the Fed is bound by its dual mandate—price stability and maximum employment. Everything else is noise.
The labor pivot is notable for what it is not: it is not about mass layoffs. Instead, it reflects a freeze in hiring and structural changes in immigration. Since May, the US has lost a net 30k jobs. Initial claims’ 4-week average is at 240k, the highest in a year but far below historical stress points (517k in the tech bubble, 665k in the GFC). Youth unemployment is 10.5%—the highest since 2021. ISM manufacturing remains in contraction, though new orders have turned higher. Southern border encounters have plummeted, and corporate layoffs total 892k YTD (+17% YoY).
In a nutshell, hiring is slowing, but firing has not yet spiked. The unemployment rate remains low on a long-term view, though Powell has acknowledged a pivot to prioritizing labor softness. We believe even a modest cut could address much of the current growth drag—while tariffs remain an under-appreciated risk, with consumer pass-through rising from 8% in April to 12% in August.
Rates/Credit/FX
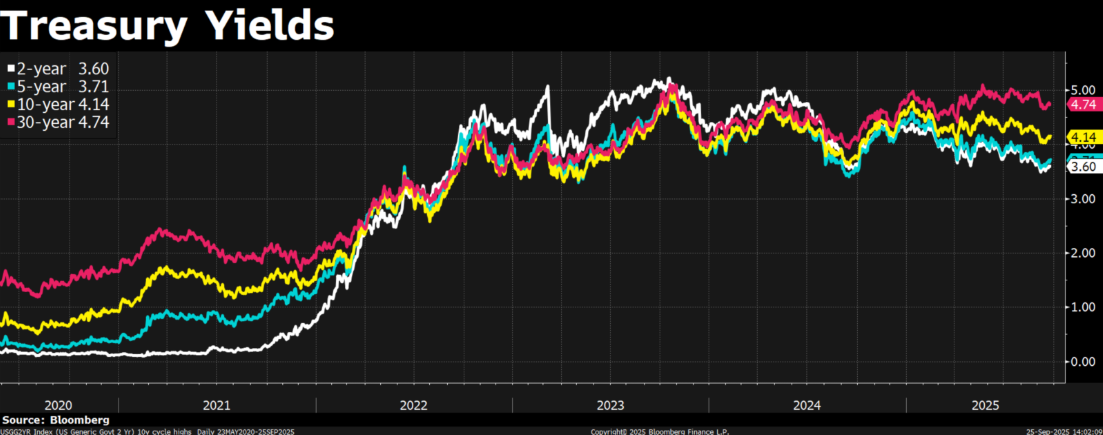
If the Fed’s dot plot plays out—four additional cuts—the policy rate would settle near 3.25–3.5%, roughly aligned with funding costs. Adding a term premium, that implies a 10y UST fair value near 4%
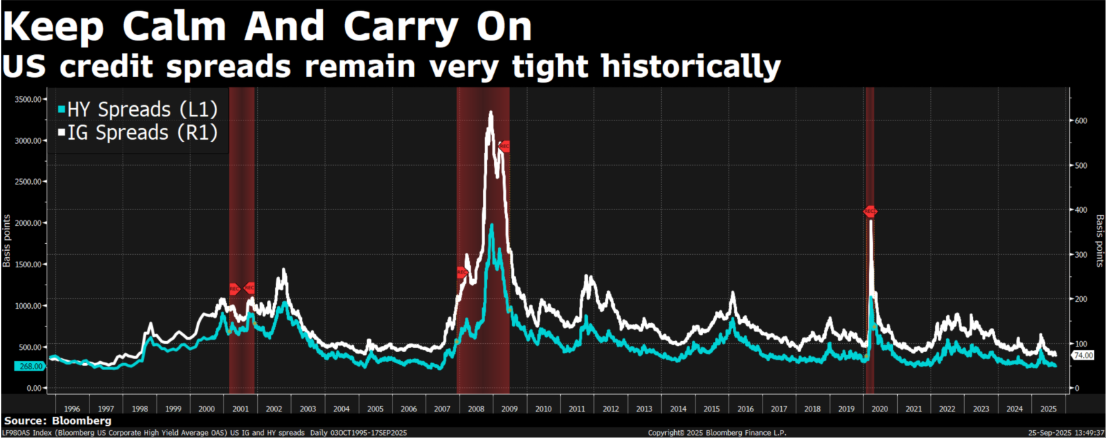
From a risk-reward perspective, adding duration here is not attractive. The 2025 front end looks fairly priced, while 2026 could see modest repricing higher. Curve steepeners no longer offer the same asymmetry as we discussed las time in June. In fact, we see scope for reversals given how steep the curve has already become. The belly of the curve, by contrast, looks overly weak. With risk assets still buoyant and major growth initiatives underway, it is difficult to justify pricing the terminal rate at current levels. Therefore, we expect 5–7y Treasury yields to rebound. On the long end, fiscal expansion is not an issue that can be quickly resolved, while cuts are already fully priced. At the same time, credit spreads remain pinned near historic tights, offering little cushion.
Taken together, the backdrop is reminiscent of September 2024 and January 2019, when yields began to move higher even during active cutting cycles. We think a similar pattern could repeat: with the short end already pricing in enough easing, the market may sell off rates during the cutting process itself. This is particularly likely as markets have become less responsive to payrolls and more prone to overestimating Fed dovishness. Expectations look stretched, while the data still point to a strong start into next year. Not until UST 10y reached 4.3% again would we begin to consider allocating back to the rates.
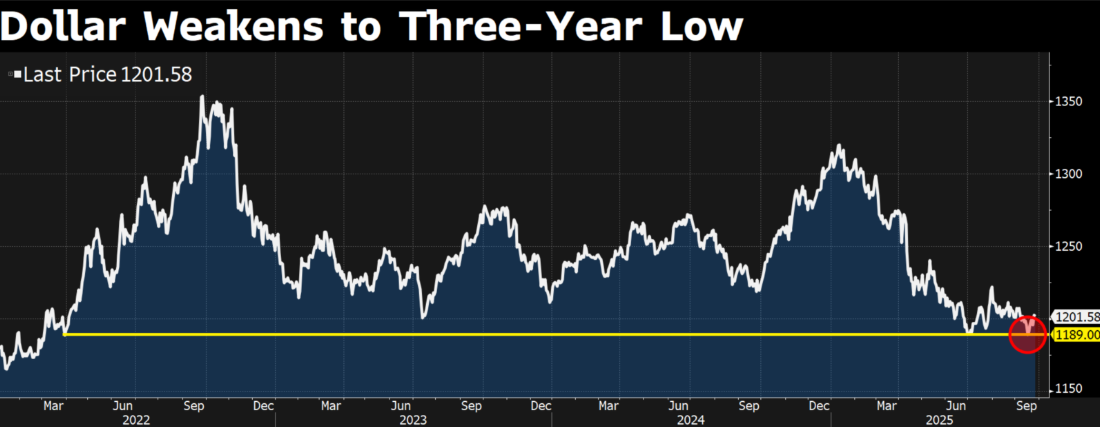
As for the dollar, historically, each “risk management cut” has been followed by a stronger dollar. Looking at the broader picture, if the upcoming cuts succeed in quickly stabilizing growth fundamentals, we think the current dollar weakness could find a floor by October. Beyond that, there are structural supports worth noting. Even though easing typically gives EMFX a near-term boost, the US is in the midst of one of the largest AI-driven investment super-cycles, with the leading companies concentrated in US equities. This dynamic should continue to attract capital flows into the US, reinforcing USD demand. Thus, we do not expect persistent pressure on the dollar into year-end. Instead, our bias is for a modest rebound in the USD through Q4, particularly as Fed policy and US growth resilience reassert themselves.
Are There Bubbles?
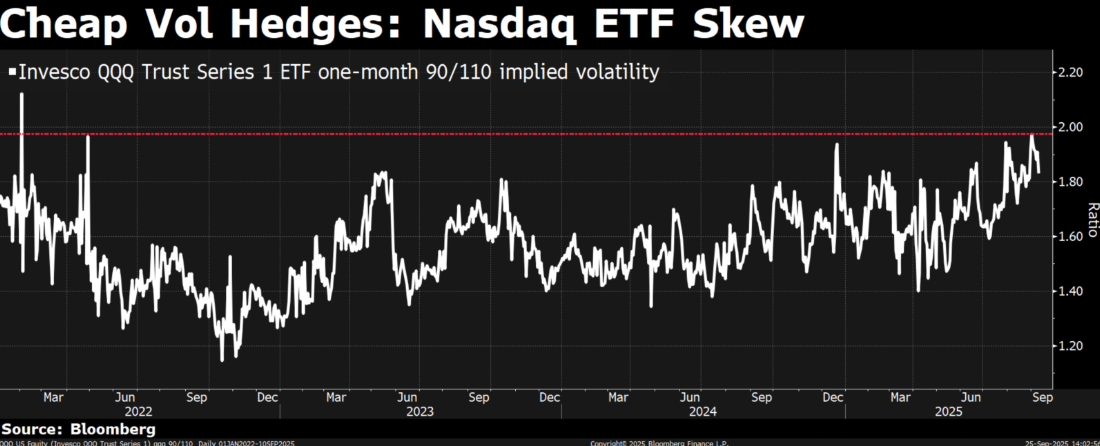
We believe that into Q4, US equities will remain choppy but biased higher, likely setting up for a larger upside resolution. The backdrop is compelling: we are entering a bullish rate-cutting cycle, financial conditions are at multi-year lows, the AI super-cycle continues to accelerate, and equity L/S managers are caught in an extreme state of “FOMO.” While some names are clearly extended, price action still argues for further upside.
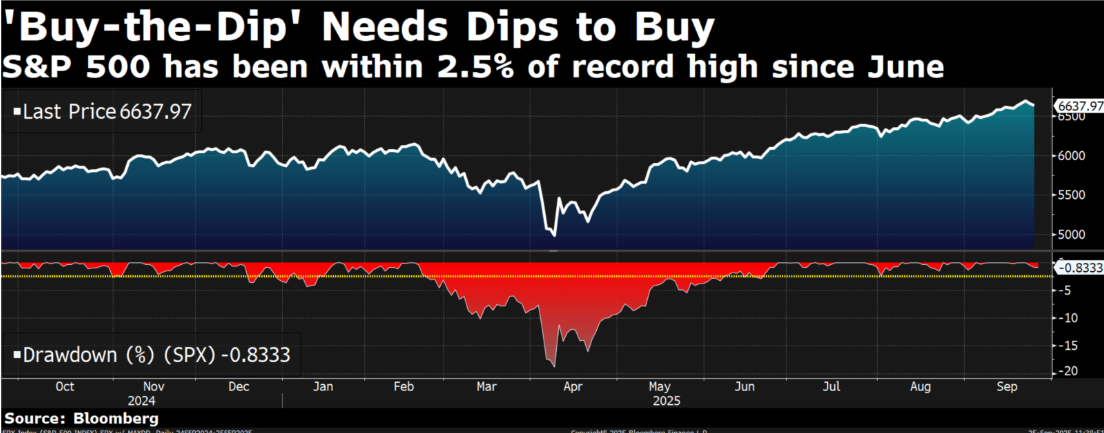
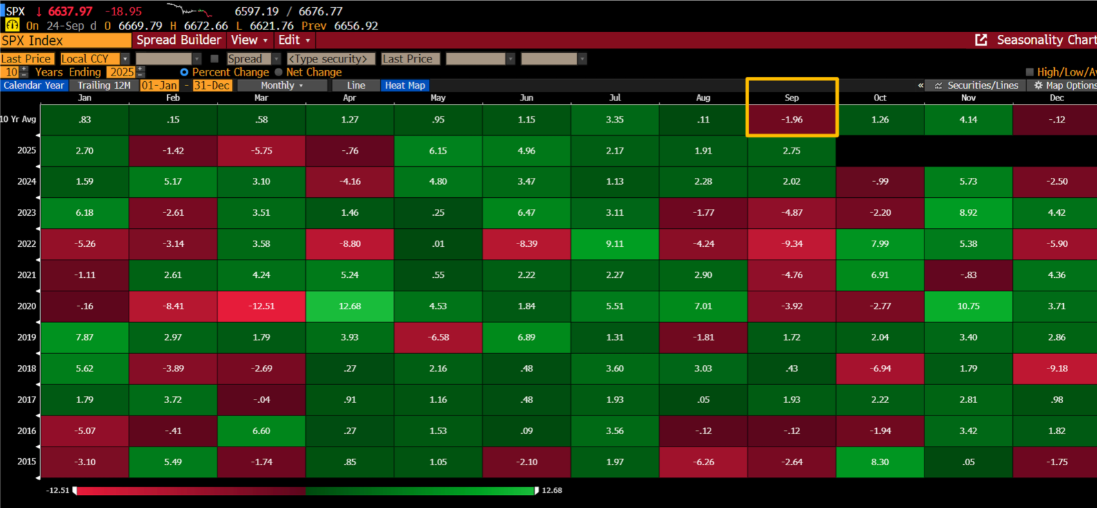
However, we are not ready to back away from the call for choppiness. Seasonals matter: the final two weeks of September are typically the weakest of the year, compounded this time by heavy options expiries from the “triple witching” period. Sentiment is euphoric, RSI is already 86, and equities look overbought. We think this sets the stage for a tactical pullback before the next leg higher. Our playbook is simple: we will buy dips. With implied vol still cheap, owning some short-dated puts allows us to stay net long and continue to play offense.
Many have been discussing whether there are bubbles, the priority should be to distinguish between types of bubbles:
- Fundamental overbuild bubble: when real-economy capacity exceeds sustainable demand, leading to digestion phases, order cliffs, and stress across supply chains.
- Price action bubble: when narrative, liquidity, and positioning force multiples far beyond fundamentals, characterized by parabolic moves, breadth divergence, extreme options activity, realized vol persistently above implied, and relentless dip-buying
Looking at today’s cycle, we do not see evidence of a fundamental overbuild. On the demand side, the AI super-cycle is unlike any past episode: GenAI chatbots are still in early innings, agents are not mature, multi-modal has not yet penetrated media, and full self-driving and humanoids remain regulatory-bound. Each stage of this evolution requires enormous compute power, and we are still at the dawn of this trend.
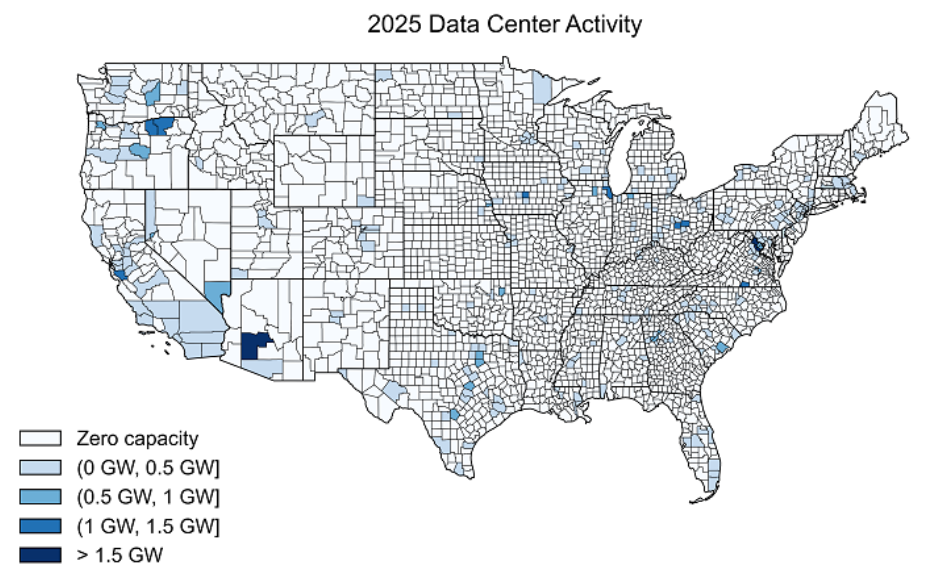
On the supply side, power and data center capacity remain tight. US data center vacancy rates are below 2.5%! We frame the question of whether it is bubble as below: we indeed see unprecedented growth and demand in the renewable power business and data center business, which is not on a speculative basis, but credited by the biggest giants in the world with the long duration (20 years plus) contracts, anchored by institutional commitments and visible TAM expansion. As Jensen Huang of Nvidia and Hock Tan of Broadcom have stressed many times in the press, these growth and orders from institutions are real. With the lasting demand-supply shortage, it is hard to call this a fundamental bubble.
And Oracle’s latest earnings highlight the new reality. EPS growth has been explosive, supported by new capex demand, and—crucially—funded by positive cash flow. Yet Oracle is now pushing vectorized databases with inference capacity, leveraging incumbency in data and GPU infrastructure. To win OpenAI deals, Oracle is prepared to go negative free cash flow. This move will likely push incumbents (Meta, Google, Amazon, Microsoft) to respond and defend their turf, escalating capex even further. This reminds us of Bryne Hobart’s Boom: every few decades, capitalism disregards return on capital to single-mindedly invest in breakthrough technologies. Debt becomes the accelerator. What started as a disciplined cash-flow-funded race could turn into a debt-fueled arms race—with Oracle having just lit the match.

Back to the question we raised – if there is a bubble? Our answer is that the fundamental overbuild bubble is not yet present, but signs of a price-action bubble are emerging. This combination suggests markets are still gathering energy for another powerful move higher—likely through Q4 and potentially beyond.
Tech Names We like
Even in a bull market, sector and stock selection matter. We avoid the quantum computing and space-exploration names that are still at the “PowerPoint stage” and far from generating meaningful cash flow. Instead, we continue to favor energy players such as CEG and VST, which stand out as fundamental winners on the back of relentless data center demand.
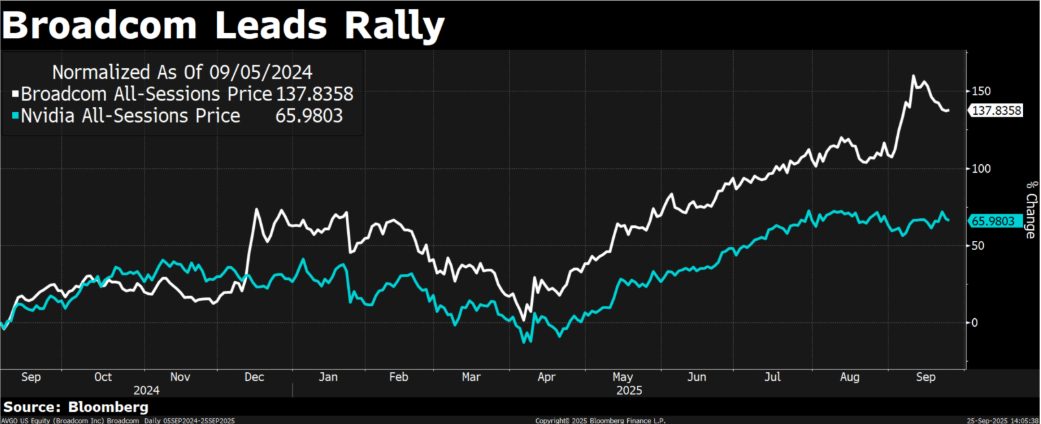
Among semiconductors, Broadcom, Nvidia, and TSM remain the high-quality leaders in this cycle and should form the backbone of core positioning. SaaS is trickier. Investors consistently worry AI search could disintermediate software, but we believe the incumbents’ accumulated experience along the way, scale advantages, and high customer retention make a full displacement unlikely. Here, names like MNDY, PLTR, ORCL, MDB, SNOW, and NET look attractive with the reasonable valuation.
We haven’t highlighted internet stocks separately, but META and GOOG should continue to dominate the ad market and benefit from higher ARPU. Other names to keep on the radar include HOOD, RDDT, NFLX, and RBLX.
A notable shift in our mindset recently is that now looks like an opportune time to lean into cyclical AI plays. Valuations have been capped by investors’ PTSD from past cycles, yet multiples are holding up and likely to remain higher for longer than consensus expects. We like Samsung, MU, and SNDK, all of which are benefiting from sharply higher memory pricing. We have been bullish on MU for some time, but previously with HBM only just beginning to contribute meaningfully, the broader AI boom is now lifting traditional memory products like DDR5 and GDDR7. This narrative looks poised to turn, with a reversal story taking shape.

We’ve spent time detailing the setup, but the conclusion is clear: this may be one of the most speculative periods in history, but crucially it is underpinned by real earnings. Our base case is a choppy but upward-trending market into year-end. At the single-name level, the focus must remain on understanding the fundamentals and framing positions within a disciplined risk/reward lens. It’s an exciting time in tech.