US Defense in 2026: From “Event Trade” to “Quasi-Infrastructure”
There are two kinds of bull markets. One is loud: prices jump on headlines, then fade when the news cycle moves on.
The other is quiet: budgets get written, factories get expanded, contracts get signed, and cash flows become easier to forecast.
U.S. defense is moving from the first to the second. Our CIO outlook for 2026 is a clear pivot: defense is no longer a short-term trade. It is a medium-term trend—driven by long-duration geopolitical competition, “sticky” budgets, and contract structures that look increasingly infrastructure-like.
Not because wars are “good for stocks.” But because deterrence has become a system—and systems require sustained spending.
Quick overview (for busy clients)
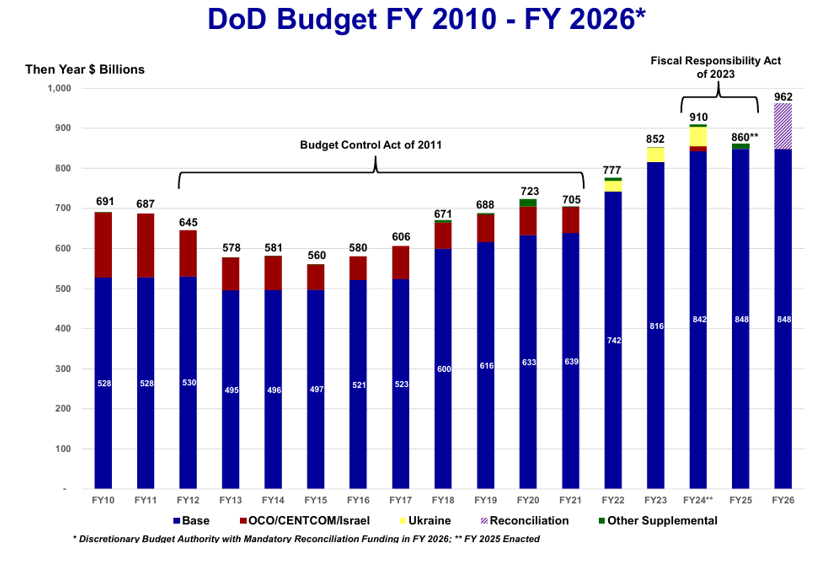
1) The spending baseline is rising: The FY2026 U.S. Department of Defense budget request totals $961.6B for DoD, and the broader “national defense” total is about $1.01T when including other defense and assumed reconciliation funding. For the FY2026 service breakdown, Air Force + Space Force accounts for ~$301.1B (~30%), Army ~$197.4B (~20%), Navy ~$292.2B (~30%), plus Defense-wide ~$170.9B (~20%).
2) Backlogs are at/near records, creating multi-year visibility.
• RTX backlog: $251B (about $148B commercial / $103B defense).
• Lockheed Martin backlog: $194B.
• General Dynamics backlog: $118B.
• Northrop Grumman backlog: $95.7B.
While backlog is helpful, “defense exposure” differs by company. Where disclosure allows, it’s more apples-to-apples to compare (i) defense vs non-defense revenue mix and (ii) defense contribution to operating and net margins, not just total size.
3) Growth lanes are not “everything defense.”: The strongest pull is where inventories must be rebuilt and systems must be integrated: missiles & munitions, integrated air/missile defense, undersea programs, and sustainment.
I. The CIO shift: why defense is becoming “quasi-infrastructure”
The simplest way to understand the2026 setup is this:
Defense is changing shape.
It used to trade like a headline asset—up on crises, down on ceasefire talk. Now it is behaving more like infrastructure: long contracts, predictable cash flow, high barriers to entry, and budgets that don’t swing with the business cycle.
That changes how we should think about valuation.
Infrastructure is not priced on “what happens next week.”
It is priced on:
• How long the cash flows last
• How reliable the payer is
• How hard it is for competitors to replace the asset
Defense, increasingly, checks those boxes.
Contract tenor (predictability, not one-size-fits-all): many major programs are supported by multi-year contracting approaches. For example, Multi-Year Procurement (MYP) contracts commonly cover2–5 years of buys under one contract vehicle… That said, accounting revenue and cash flow can diverge…but longer contract structures + funded backlog typically raise predictability.
II. Tailwind #1: geopolitics is becoming long-duration, not one-off
Global security risk has become structural.
SIPRI — Stockholm International Peace Research Institute — reported world military expenditure reached $2.718Tin 2024, the steepest year-on-year rise since at least the end of the Cold War. Out of that, the United States spent about $997B, ~37% of global military spending
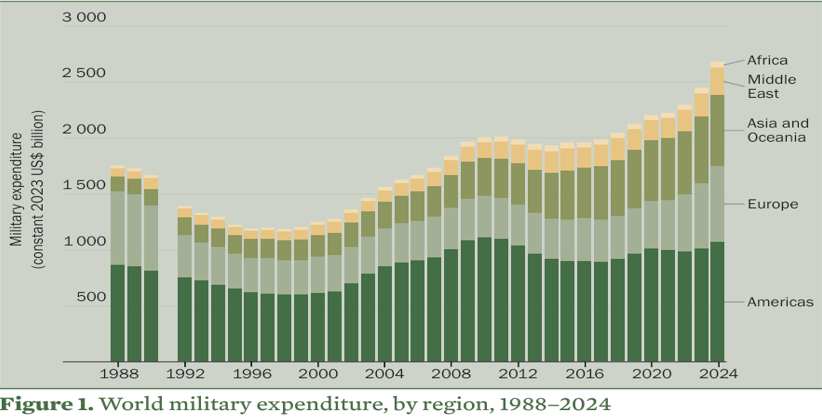
This matters because it signals a shift from episodic procurement to sustained rearmament. In that environment, the winners are not just those who win a single program—they are those who sit inside multi-year capability buildouts: air defense networks, missile production capacity, secure communications, and undersea dominance.
Client translation: this isless “panic buying” and more “system building.”
III. Tailwind #2: defense budgets are sticky—and hard to reverse
Defense budgets behave differently from most government spending.
Once a government raises defense funding, it usually triggers:
• multi-year programs,
• workforce expansion,
• supply chain investment,
• and political commitments tied to national security.
These are difficult to unwind quickly.
TheFY2026 DoD materials also frame priorities around homeland defense, Indo-Pacific deterrence, and allied burden sharing, reinforcing a longer planning horizon.
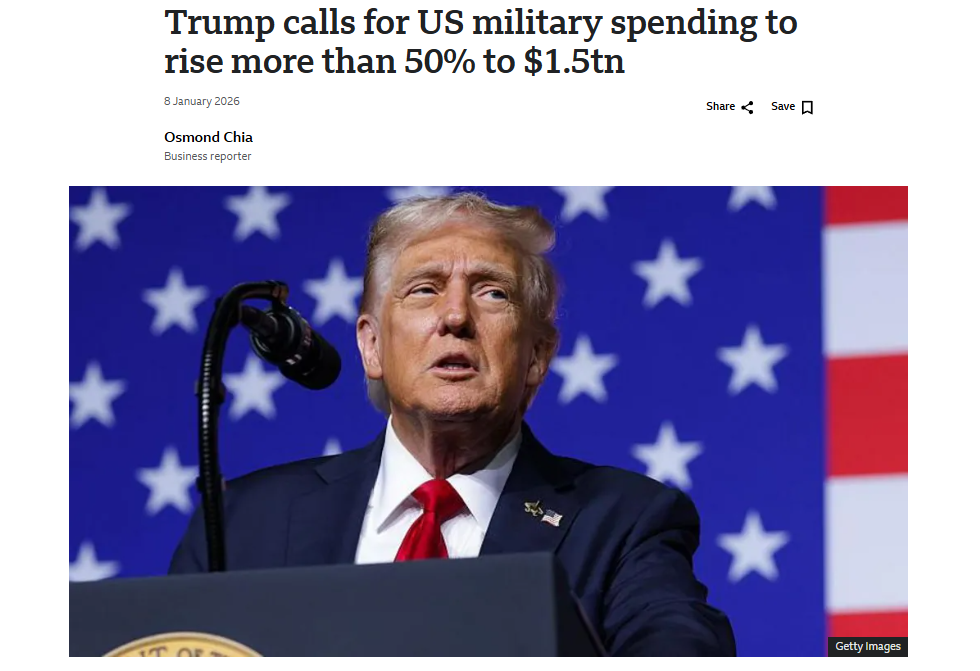
And markets are also watching the political debate around a possible 2027 jump to $1.5T in military spending proposals—whether or not that exact number becomes law, it signals upward pressure on the spending conversation.
Our call: a straight jump to $1.5Tis unlikely given political and fiscal constraints, but the messaging itself is still a tailwind—it reinforces that budget pressure is more likely to be up than down.
IV. Tailwind #3: the contract model creates visibility (backlog is the “bridge”)
Defense is not a perfect annuity—but it has more visibility than most sectors.
That is why backlog is so central.
Backlog is not just a big number. It is a practical answer to a client’s question:
“How much future revenue is already ‘booked’?”
Today, the answer is: a lot.
• RTX ended Q3 2025 with $251B backlog, including $103B defense.
• Lockheed reported $194B backlog in its FY2025 results.
• General Dynamics ended FY2025 with $118B backlog.
• Northrop reported $95.7B backlog.
Why this matters for valuation: When investors can estimate forward revenue and cash flow with higher confidence, the sector can deserve a different lens than pure “event risk.”
V. “Defense as infrastructure” changes what we measure
If defense is transitioning from event-driven to infrastructure-like, we should watch metrics that reflect durability:
1) Defense budget growth vs GDP growth: Not because GDP drives defense demand directly, but because it shapes political capacity and tradeoffs.
2) Customer concentration (usually one big customer): The U.S. government is the core buyer. That is a risk (policy shifts), but also a stability factor (credit quality).
3) Backlog “years”: A client-friendly shortcut: backlog ÷ annual revenue as a rough indicator of how many years of work are already sold.
4) Barriers to entry: Defense is not a normal competitive market. Qualifications, security clearances, testing history, and production credibility matter as much as price.
VI. Where the growth is in 2026: four lanes thatmatter
The defense “supercycle” is not evenly distributed. The strongest demand tends to cluster where the gap between needs and capacity is widest.
Lane 1 — Missiles & munitions: replenishment becomes policy
• Modern conflicts burn through interceptors and precision munitions faster than peacetime models assumed. The result is steady demand for production scale—not just R&D.
• Why investors care: production scale is hard, slow, and valuable. Once factories expand, follow-on orders tend to persist.
Lane 2 — Integrated air & missile defense: systems, not parts
• Integrated defense is not one product. It is a network: sensors, radars, interceptors, software, command-and-control, secure communications. The FY2026 DoD framing emphasizes urgent homeland defense strengthening and Indo-Pacific deterrence—both aligned with integrated defense priorities.
• Why investors care: systems integration tends to favor incumbents with long track records and deep relationships.
Lane 3 — Undersea & shipbuilding: long lead times, long visibility
• Undersea platforms are expensive and slow to produce. That means backlog tends to be long and durable.
• General Dynamics, with its Marine Systems exposure, is a clear example of how shipbuilding can translate into multi-year booked work (reflected in the company’s record backlog).
Lane 4 — Sustainment: the quiet compounding engine
• Even if new procurement rises and falls, sustainment often stays. Fleets last decades. They require: parts, maintenance, upgrades, training, and software refresh cycles.
• This is one of the most “infrastructure-like” cash flow streams inside defense.
VII. Diversification matters: defense exposureisn’t always “pure defense”
A useful client point: some primes have meaningful non-defense exposure, which can soften volatility.
• RTX’s backlog shows a large commercial aerospace component ($148B commercial vs $103B defense at Q3 2025).
• General Dynamics includes Gulfstream business aviation within its Aerospace segment (alongside defense-heavy segments), and reported strong segment performance in FY2025.
Why investors care: diversification can help earnings stability, but it also means you must understand what is driving each company’s margins and cycle. While defense contracts tend to offer strong visibility, commercial contracts often deliver higher margins
VIII. Second-order beneficiaries: why allied capacity (e.g., NATO and Korea) matters
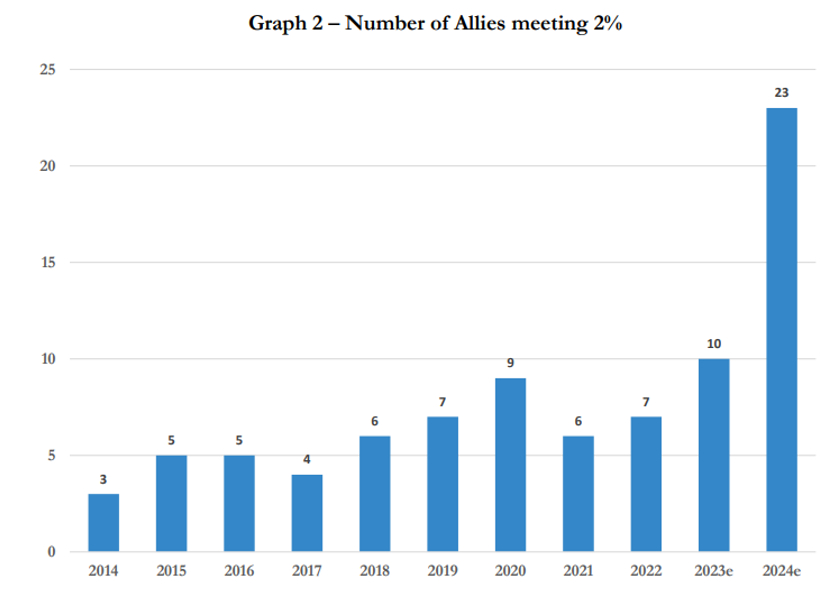
The U.S. is not rearming in isolation. NATO’s spending trend is moving up, and reporting in 2025 indicated expectations that all allies would meet or exceed the 2% GDP defense spending target.
At the same time, allied industrial capacity is becoming strategically important. When delivery speed becomes a constraint, countries that can manufacture quickly and export competitively become structural beneficiaries.
This is where places like South Korea enter the conversation. Research has highlighted Korea’s rise as a defense exporter and the post-2022 acceleration of demand. (For the broader “rearmament” impulse that creates the export pull.)
Digging deeper on ‘selling to foreign countries’: major U.S. defense primes also sell to allied governments—often via U.S.-run security cooperation channels. In FY2024, the U.S. State Department reported $117.9B in Foreign Military Sales (FMS) and related activity…
Client translation: allies often ‘buy capability + interoperability + an implicit security umbrella,’ creating a second demand engine beyond the Pentagon alone.
IX. The risks clients should keep in mind
Defense is attractive in this regime, but not risk-free:
1) Politics and budget timing: Appropriations can be delayed. Program funding can be reshuffled.
2) Execution risk: Large contracts can slip on schedule or cost. The market tolerates issues—until it doesn’t.
3) Supply chain and labor constraints: Scaling production is hard. Bottlenecks can cap near-term deliveries even when demand is strong.
4) Policy pressure on contractors: Recent public debate has included scrutiny over capital returns vs reinvestment into production capacity. (AP News)
5) Valuation risk: When a theme becomes popular, prices can run ahead of fundamentals. “Infrastructure-like” does not mean “price-insensitive.”
Conclusion: defense is being repriced from “headline” to “system”
Our CIO message is simple: Defense is becoming a medium-term allocation.
Not because the world is “more dangerous this month,” but because the world is reorganizing around long-duration competition—and deterrence requires sustained investment.
When spending becomes sticky, when backlog becomes multi-year, and when contracts turn into predictable cash flows, defense stops behaving like an event trade.
It starts behaving like quasi-infrastructure.
